| Tool Mentor: TEC - Perform Problem Management |
 |
|
| Related Elements |
|---|
ContextTool mentors explain how a tool can perform tasks, which are part of ITUP processes and activities. The tasks are listed as Related Elements in the Relationships section. You can see the details of how processes and activities are supported by this tool mentor, by clicking the links next to the icons: DetailsThe IBM® Tivoli® Enterprise Console® product receives alert data from the environment and either directly due to a specific alert or a correlation of related alerts, will generate an event in Tivoli Enterprise Console that either appears on the console for an operator to take action on or opens an incident through automation. An important point to note in the root cause analysis activity is that an event can be generated by a causal association. Therefore when an administrator examines the events, they should be aware if the event was generated at the Tivoli Enterprise Console server based on other received events or by reception of a single event. IBM Tivoli Enterprise Console has both a Java™-based and a Web-based console for viewing events. When the administrators for a problem is investigating and diagnosing, it is common for them to pull up their (Web or Java) Tivoli Enterprise Console to obtain the entire event history. The information available at the Tivoli Enterprise Console can lead in the investigation of the issue as other possibly related events in the environment can also be observed at the Tivoli Enterprise Console. There are also many command line functions that can be used to retrieve information about events from the Tivoli Enterprise Console database. The following passage from the Tivoli Enterprise Console 3.9 User Guide explains how to view the event details. All current manuals are located on the IBM Web site in the Tivoli Information Center at http://publib.boulder.ibm.com/infocenter/tivihelp/v3r1/index.jsp?toc=/com.ibm.itec.doc_3.9/toc.xml.
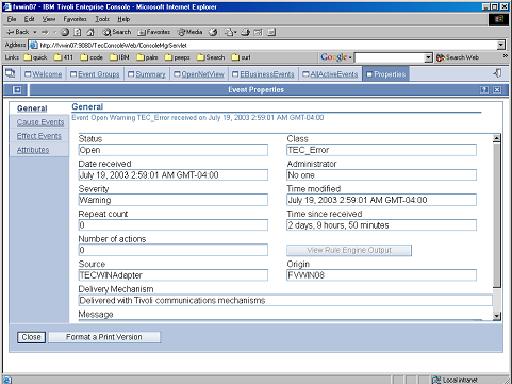
The information available in a specific Tivoli Enterprise Console event includes the following types of information:
You can determine the event reception time, the alerting mechanism (source) where the event came from, specific alert message strings from the vendor (or programmers), the host, and also some indication as to the criticality that the organization is placing on the event. The information obtained by viewing the events and their attributes can be critical information in root cause analysis. When the root cause analysis is complete, any resulting causality information can be put into the logic of the Tivoli Enterprise Console rules so that the Tivoli Enterprise Console server can be more predictive. As an example, it might be determined that there was an alert that preceded an event where the temperature rose above a normal threshold (not yet reaching critical) because the fan in a server was spinning slowly but not below the threshold to alert to the fan failure. In that case, it might make sense to adjust the alerting and make the appropriate monitoring and event analysis changes to trigger an event for the rise in temperature. A simple example of what might happen as to the results of the root cause analysis is as follows: The severity of the event might be changed as the business impact is determined to be greater than previously believed. This action might result in necessary changes to the trouble-ticket or to the script that the Tivoli Enterprise Console operator uses to act upon the received events. For More InformationFor more information about this tool, click on the link for this tool at the top of this page. |
©Copyright IBM Corp. 2005, 2008. All Rights Reserved. |