| Tool Mentor: TNM – Problem Management |
 |
|
| Related Elements |
|---|
ContextTool mentors explain how a tool can perform tasks, which are part of ITUP processes and activities. The tasks are listed as Related Elements in the Relationships section. You can see the details of how processes and activities are supported by this tool mentor, by clicking the links next to the icons: DetailsA failure situation on the network usually generates multiple events creating noise on the operator's console. IBM® Tivoli® Network Manager (TNM) correlates all events related to a single failure on the network using the topology information it has discovered from the network. TNM identifies the root cause of the network failure and correlates all symptomatic events to this root cause. Symptomatic events are identified and their criticality is reduced – network operators should focus corrective action on significant events. TNM can also enrich events with the network topology information it has discovered. This correlation process reduces the event flood from network failures focusing network operations staff on a manageable set of significant events. Refer to tool mentor TNM – Correlate Events and Select Response for additional details. Network Manager includes several tools to allow the user to diagnose network problems and speed up event resolution. Network Manager also includes a server-side SNMP MIB browser. The MIB browser is a graphical user interface that enables the user to:
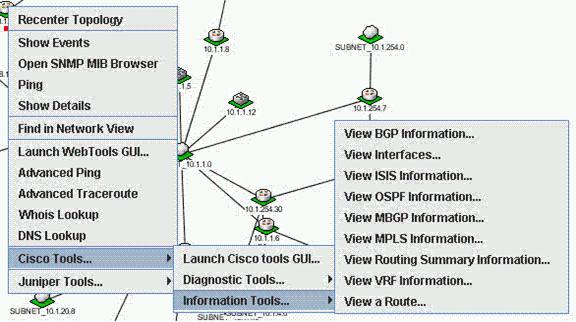
The SNMP queries are initiated from the TNM host machine using the same network access credentials as the TNM application. TNM further provides additional tools from its network topology GUIs. Some of these tools are used to launch vendor-specific operations, while administration and maintenance (OAM) tools are used to diagnose a problem on a specific device. These tools are context-sensitive and configurable – the operations available for a selected device will be specific to that device.
Figure 1. Integrated vendor specific OAM tools for event diagnostics
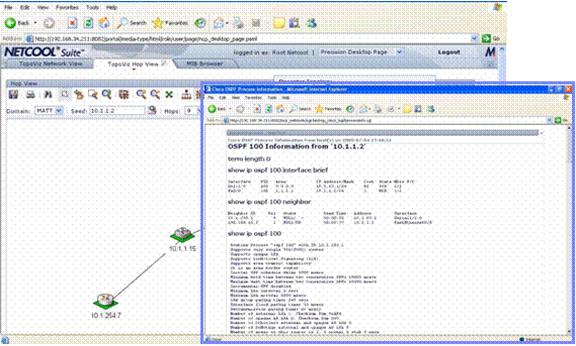
Figure 2. Output from View OSPF Information tool from Cisco For more informationFor more information about this tool, go to the IBM Tivoli Network Manager page. |
©Copyright IBM Corp. 2005, 2008. All Rights Reserved. |

