| Tool Mentor: TNO - Problem Management |
 |
|
| Related Elements |
|---|
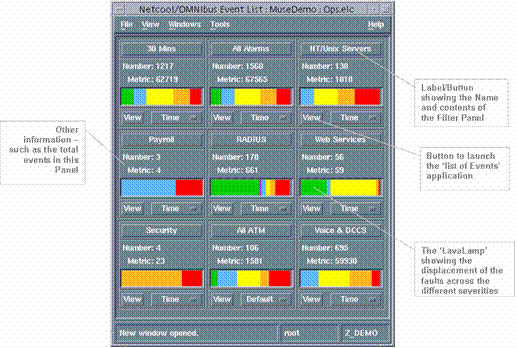
ContextTool mentors explain how a tool can perform tasks, which are part of ITUP processes and activities. The tasks are listed as Related Elements in the Relationships section. You can see the details of how processes and activities are supported by this tool mentor, by clicking the links next to the icons: DetailsThe IBM® Tivoli® Netcool/OMNIbus product receives alert data from the network and server environment and either directly due to a specific alert or a correlation of related alerts, will identify a probable or root cause event and optionally automatically open an incident record. All current events are stored in the memory resident ObjectServer database and are available to filtered Desktop views for investigation and management The Netcool/OMNIbus Native Desktop provides two views: the monitor console, showing high-level monitor or summary views, and the event list, showing filtered alarm views. The Desktop allows an operator to immediately visualize the major problem areas of the managed systems. The monitor console shows events grouped into configurable categories such as:
The Filter or Association panels show the following:
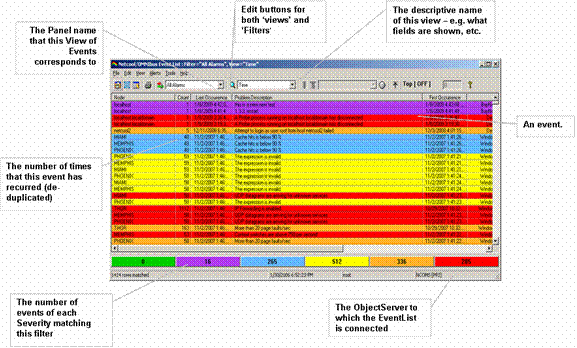
The Desktop provides a range of configurable options controlling appearance, refresh rates, and the notification behavior of the event list when new events arrive. Notification may be by pop-up and/or audible alarm. New events may be set to flash if required. A single event consists of 26 standard fields including, for example, affected Node or Device, repeating event count and Problem description or Summary:
The underlying ObjectServer schema can be modified to provide additional information as required. The event may be structured to common standard forms for example x733. All fields of the event can be shown, but it is more likely to show only those fields which are important to an operator at first glance. A pull-down list is available to display all fields in a selected event. The event list provides the operator with a personalized view of the active events, together with a range of customizable tools supporting alarm management.
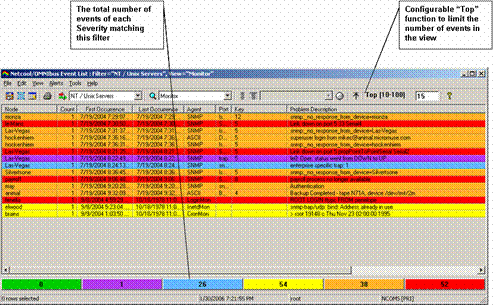
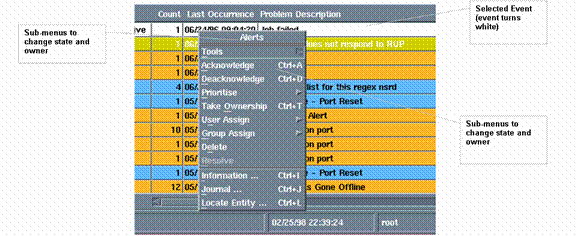
Events can be ordered and re-sorted by operator interaction. Events can be selected, acknowledged, assigned to, re-prioritized, and deleted (if the user has the correct authorization privileges). The scroll bars allow full event information to be viewed. You can scroll down through all the alarms in the system. If you use the horizontal scroll bar at the base of the event list, you can see the complete set of information available for each alarm. The Summary bar, located below the horizontal scroll bar, shows the total number of events by severity that match the filter for this view. Clicking on a severity causes a temporary additional filter to be applied to limit the view to the events of the selected severity. An All Events button is activated on the bar, enabling a return to the 'All events for this filter' view. Top(n) EventsThe Desktop includes 'Top N' functionality allowing for a controlled reduction in the information presented to the user, and aiding rapid fault diagnosis. The administrator can set a minimum and maximum range for operator selection, or can lock the definition, preventing user modification. Note that the Severity summary bar continues to indicate the total number of events matching the filter view.
The Alerts MenuThe alerts menu provides a context-sensitive set of functions that may be further customized by the administrator.
The default menu options are summarized below:
All these functions are automatically 'journalized' in the system, with the date, time, and operator who changed the function. This provides an audit trail of what happens to an event, automatically. In addition, each of the menu functions is user access controlled. While it is feasible through the flexible configuration of the Probe, ObjectServer schema and Desktops to fully manage an Event as a Problem or Incident, the majority of installations will make use of a Help Desk style application for the generation of a Problem Ticket. Netcool bi-directional gateways enable the ObjectServer to seamlessly integrate with all major Help Desk and Service Center applications that leading companies use to resolve faults and ensure service availability. The Netcool/OMNIbus application can automatically open a trouble ticket in the corporate help desk system and populate it with the enriched event messages, as well as obtaining ongoing status reports on each trouble ticket. "Point and Click" Desktop tools also allow the Operator to initiate the Ticket process where manual intervention is necessary or preferred. The Netcool solution can provide inserts into the target system and also send subsequent updates, journal entries or closures. Netcool provides the ability to open, update, and notify the trouble ticket system to close the ticket. Similarly, Netcool can receive updates and notification to clear the event from the trouble ticket system. Severity, priority, assigned to, and others are typical data elements exchanged between Netcool and the trouble ticket system. For More InformationFor more information about this tool, click on the link for this tool at the top of this page. |
©Copyright IBM Corp. 2005, 2008. All Rights Reserved. |