| Tool Mentor: OMEGAMON - Perform Problem Management |
 |
|
| Related Elements |
|---|
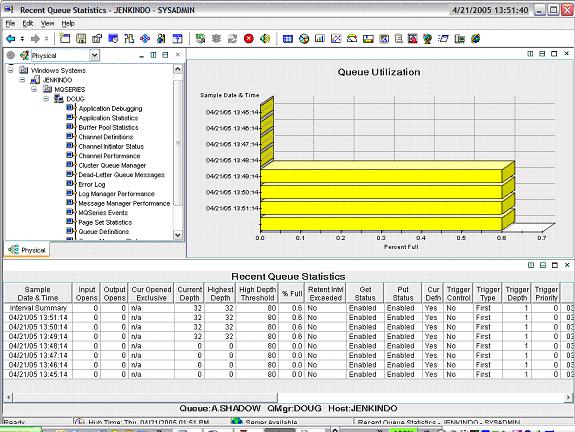
ContextTool mentors explain how a tool can perform tasks, which are part of ITUP processes and activities. The tasks are listed as Related Elements in the Relationships section. You can see the details of how processes and activities are supported by this tool mentor, by clicking the links next to the icons: DetailsProblem Management differs from Incident Management in that it seeks to identify recurring problems that could cause more serious problems down the road. Often this is done with Incident Management tools in conjunction with trending tools. The IBM® Tivoli® CandleNet Portal component of OMEGAMON® provides several ways to work with recurring problems and problem trends. Event persistenceMany 'problems' are transient events that can often be overlooked if they occur only once. But they need closer investigation if they persist for a longer period of time. For alerts created in the IBM Tivoli CandleNet Portal, the frequency to check for events can be set using the Advanced tab in the Situation Editor. Under the Situation Persistence tab, you can specify the number of consecutive intervals at which the situations need to be true before the alert is raised. In this way, true problems can be separated from the noise, and only real problems investigated. For example, a WebSphere® MQSeries queue manager is recycled once a week at 2 am. When the queue manager is down, the agent raises the alert. By the time the on-call person gets up and logs onto the system, the queue manager is already back up. By setting the persistence to a larger number, the alert will not be raised during the time of the recycle. A good number will be the amount of time it takes for the queue manager to be recycled divided by the situation interval (the interval between evaluations of the situation). If it takes 15 minutes to recycle the queue manager, and the situation is set to check every 5 minutes, then a persistence of 3 or 4 will be a likely setting. Short-term and Long-term historyInformation displayed in an IBM Tivoli CandleNet Portal workspace for a monitored attribute is the current value for that item. Before a specific value can be considered a problem, it is important to see it in the context of recent and long-term history. Short-term history is configurable from short intervals such as 15 minutes, to longer intervals such as 8 hours. (The exact setting location varies by monitoring agent.) From a current table display, the product-provided workspaces contain a link (indicated by a blue chain-link symbol at the beginning of the row) that is used to navigate to additional workspaces. Mouse-over the link symbol to see the default setting, and left-click the link symbol to select it. If the default is not short-term history, right-click to see the other link destinations and then select short-term history. (The terms used can also be Recent and Historical.) This action will bring up a workspace that will show the recent history in a bar chart, as well as a table of the same data, providing for easy identification of spikes or trends.
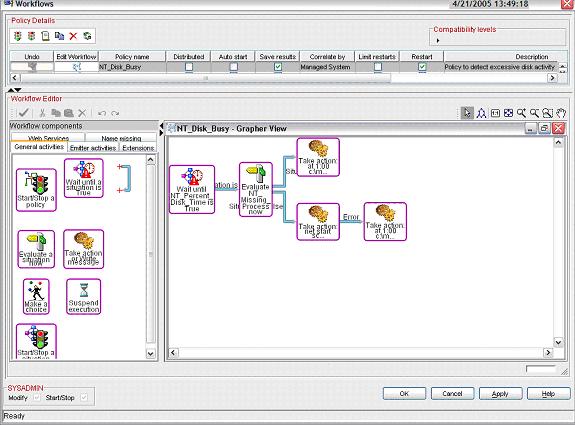
Long-term history is usually history older than 24 hours and is accessed in the same manner. In each of the bar chart and table views, there will be an icon in the upper-left corner of the view that looks like a clock with a question mark. Mouse-over the icon and it will say Specify Time Span for Query. Click on the icon and you will be presented with a popup in which you can make a selection based on relative time, such as the last 24 hours, or specific time periods based on date and time. History Data WarehouseThe long-term history is kept in flat files on each monitored system or it can be sent to a central data warehouse (using an ODBC connection). Use of a central data repository provides the capability of building reports to show activity across months or even years, or compare current activity to the way it was a year ago. Historical configuration is performed using the History Configuration icon on the IBM Tivoli CandleNet Portal toolbar. A popup window allows you to select the product (WMQ, WebSphere Application Server, UNIX®, and so on), and then the specific groups of attributes for which you want long-term history. Additional settings control how often to send the data to the warehouse, as well as starting and stopping the historical data collection. Not only does the data warehouse allow centralized management of the data, but it also removes the need to manage the local flat files on each system. PoliciesAnother feature of the Tivoli Management Portal, Policies, allows an alert to start a workflow of activities. These activities can involve issuing a system command, waiting a period of time, checking to see if the situation was resolved, and notifying someone (whether success or failure) of the results. This action is also the method used to send the alert to another tool such as the Tivoli Event Console, or a service desk tool. Along with the fact that the alert was raised, specific attributes such as names and values, system, date, time, and so on, can also be included. Policies are created using the Workflow Editor icon from the Tivoli Management Portal tool bar. Icons on the left side are dragged to the main work area and connected to provide the flow, for true and false, success or failure paths through the workflow.
Further information may be found in the following manuals:
For More InformationFor more information about this tool, click on the link for this tool at the top of this page. |
©Copyright IBM Corp. 2005, 2008. All Rights Reserved. |

