| Tool Mentor: CAM WS - Investigate and Diagnose Problem in Problem Management |
 |
|
| Related Elements |
|---|
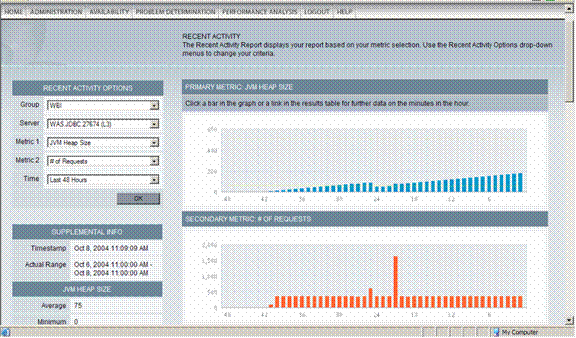
ContextTool mentors explain how a tool can perform tasks, which are part of ITUP processes and activities. The tasks are listed as Related Elements in the Relationships section. You can see the details of how processes and activities are supported by this tool mentor, by clicking the links next to the icons: DetailsMemory leaks within the JVM are very difficult to isolate, and usually surface only when somebody notices that the heap size is continually growing over time, or application performance is degrading. At some point, the lack of available heap storage can cause applications or even WebSphere® Application Server itself to hang, resulting in the inevitable restart of the server in order to clear up the problem. Many customers take the proactive approach of scheduling "therapeutic" restarts of their servers in anticipation that memory leaks will occur and cause serious problems if left alone. Memory allocation within a Java™ environment is quite different from traditional legacy-based systems. The JVM itself handles all memory management functions on behalf of the applications. The big advantage is that application developers need not be concerned about such relatively mundane operations; they can focus solely on memory issues that arise. It's often difficult to trace these errors back to any particular piece of application code that might be causing the problem. Many companies will take a trial and error approach, removing a portion of code, seeing if the memory leaks continue, removing another portion of code, and so on, and so forth. This approach is obviously less than optimal. IBM® Tivoli® Composite Application Manager (ITCAM) for WS provides industry-leading technologies to assist customers in diagnosing and resolving memory-related issues. The Memory Diagnosis section is broken down into three separate components, Memory Analysis, Heap Analysis, and Memory Leak Detection. Memory Analysis allows the data center administrators or developers to generate real-time reports against one or more memory-related metrics. For example, you can plot heap utilization over time, say for the past hour, and visually see if the heap is growing or shrinking. If it is growing then that might or might not be indicative of an actual problem, ITCAM for WS gives you the ability to plot a secondary metric to help make this determination. The idea here is that examining how two distinct, but related, metrics behave over the same period of time can yield important clues as to the inner workings of the JVM. Below is an example of what the report looks like:
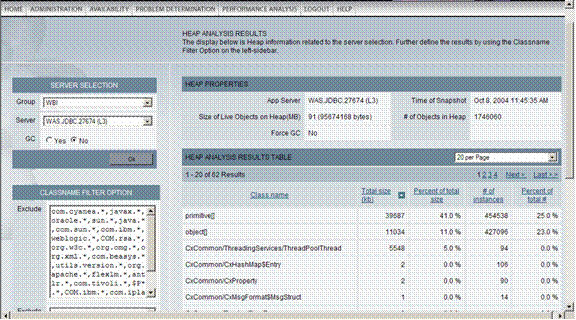
Here, you can see that for nearly the past hour, JVM heap size has continually grown, but it also shows that the number of requests has remained fairly constant. Thus the continuous growth of the heap might be cause for concern and could be indicative of an actual memory leak. When it is determined that the increased heap size should be further examined, the next step that a data center administrator or developer might take is to go into the Heap Analysis component and get a complete listing of the heap contents. The output of that listing would look similar to the following:
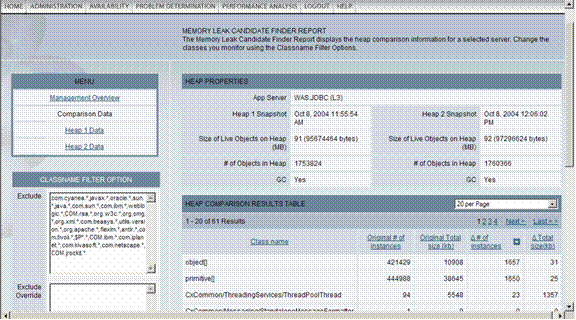
Here, we see the entire contents of the heap broken down by class name, along with total size in kilobytes, number of instances (objects) and the percentage of the entire heap these numbers represent. By viewing this one screen you can easily determine the specific Java classes that are contributing the most to overall heap utilization. By default, the output is sorted by class name, but you can choose to sort by any of the other columns simply by clicking on that column's heading. ITCAM for WS also gives you the ability to exclude certain class names from the display by entering those classes in the Classname Filter Option section. The benefit here is that you can limit the result set to those sets of classes that are possibly suspect, and filter out classes that are known to be good, typically vendor code or application classes that rarely change. Now that you have honed in on a couple of suspicious Java classes, the next step is to determine if the amount of heap those classes are utilizing is consistent, or if their heap utilization is continuing to grow. To do this, you would use the Memory Leak Analysis component. This is similar to Heap Analysis, but the difference is that instead of just taking a single snapshot of the heap contents, we are saving two separate snapshots of the heap taken at different points in time, and then comparing the differences between them. The output from that analysis looks like this:
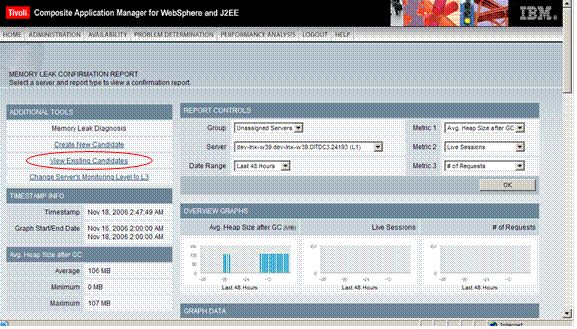
In the screenshot above, you can see the number of objects associated with each class. If you see significant, or abnormal, growth during the 30-minute interval between the times that the heap snapshots were taken, the memory leak problem is likely being caused by code within these classes and should be further investigated. Once you have identified the suspect classes, you can take further steps to narrow in on the specific code segment responsible for the leak, by looking at the potential candidates for memory leaks:
Each line of this report represents an allocation pattern, uniquely identifying a set of heap objects of the same class, allocated by the same request type, and from the same point in the application code. 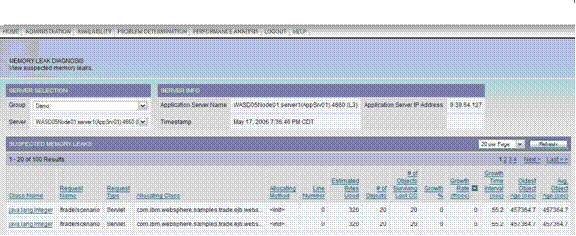 Figure 5: Detailed Memory Leak Report By clicking on the Class Name we can view the References to Live Objects on the Heap page that further pinpoints why the objects in question are not getting garbage collected. Furthermore, it shows the other objects on the heap which contain references to the set of objects being analyzed, and the actual line number within the code module responsible for the reference. Most often, this establishes the root cause of the memory leak. In v6.1 of the tool, we also provide a link to the Memory Dump Diagnostics for Java (MDD4J) which is available on the IBM Support Assistant (ISA) CD. The ISA is a no-cost download for customers of the WebSphere Application Server. MDD4J allows users to perform offline detailed analysis of memory dumps. MDD4J comes with its own documentation and help functions. Memory dumps can be scheduled from ITCAM for WS in a format compatible with MDD4J.
To quickly summarize, this example demonstrates the following: Using Memory Analysis, we quickly determined that heap utilization was continually on the rise, in spite of a stable number of requests. This result is our first indicator that a memory leak might have surfaced in the environment. Using Heap Analysis, we identified all of the objects within the heap, what specific classes they were associated with, how large these objects were, and what percentage of the total heap size they represented. The number and size of some of these objects are additional indicators of a potential memory leak. Using the Advanced Leak Determination feature, we obtained a highly granular view of referenced objects in the heap, and can evaluate each potential class and method to pinpoint the line number in the code responsible for the long lived, referenced object not getting cleared from the JVM heap by Garbage Collection cycles. Through Memory Leak Analysis, we compared two separate snapshots of the heap and were able to isolate specific application classes that had increased heap usage over time. This increase confirms the fact that these classes are suspect and are the likely culprits. ITCAM for WS helps customers take the guesswork out of solving highly complex application management issues, particularly common, yet hard-to-solve ones, such as memory leaks. For More InformationFor more information about this tool, click on the link for this tool at the top of this page. |
©Copyright IBM Corp. 2005, 2008. All Rights Reserved. |
