| Tool Mentor: CAM WS - Problem Management |
 |
|
| Related Elements |
|---|
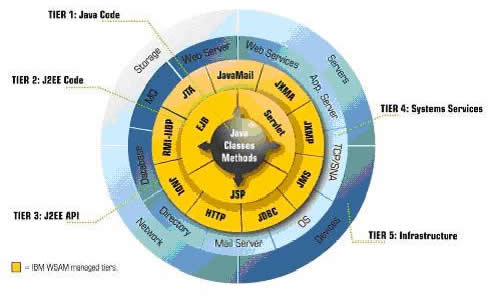
ContextTool mentors explain how a tool can perform tasks, which are part of ITUP processes and activities. The tasks are listed as Related Elements in the Relationships section. You can see the details of how processes and activities are supported by this tool mentor, by clicking the links next to the icons: DetailsIBM® Tivoli® Composite Application Manager (ITCAM) for WebSphere® helps operations and application support teams maintain high service levels by providing these groups with the tools to monitor and optimize performance, as well as diagnose and fix problems in development, quality assurance, and production environments. Figure 1 provides a solution blueprint of this product, which manages WebSphere applications from multiple perspectives, depending on symptoms and diagnostics steps.
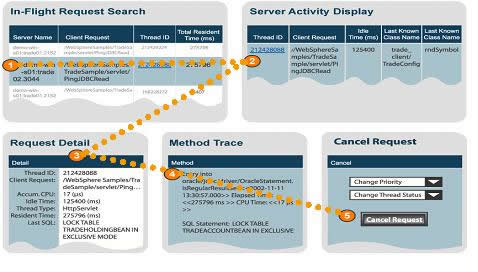
ITCAM for WebSphere PerspectiveITCAM for WebSphere has an application-centric point of view into your enterprise. By permitting application support teams to characterize activity from the inside out, from individual Java™ class and method calls through J2EE Application Server resources utilization, ITCAM for WebSphere gives you visibility into the WebSphere/J2EE "black box" and provides the information necessary for managing composite applications, including those that span WebSphere to CICS and IMS host environments. ITCAM for WebSphere Problem-solving PhilosophyITCAM for WebSphere manages the performance of WebSphere/J2EE applications by providing an integrated set of application server monitoring, problem determination, and performance analysis tools to help customers ensure the health of their WebSphere applications and server environments. This also forms a key enabling technology base in support of performance automation within the broader context of IT Services Management and on-demand computing. The design of ITCAM for WebSphere lends itself to a top-down approach to performance management, as shown in Figure 2.
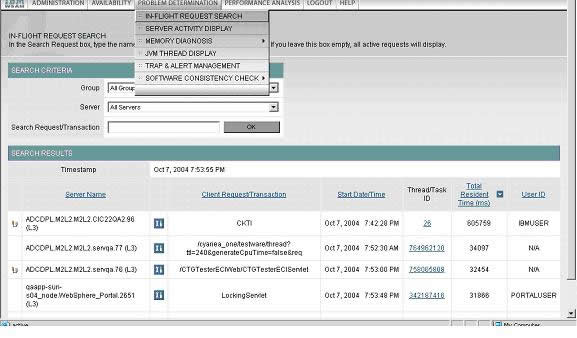
The drilldown starts from the Enterprise and progresses to Application, Server, Thread, and then Request. In addition, you can analyze performance of transactions after they have completed. In the Performance Analysis and Reporting section, you can analyze performance and also drilldown into the problem. ITCAM for WebSphere understands that one size does not fit all. Because there are trade-offs between the amount of data collected and system performance, you can configure the application monitor to capture the appropriate amount of data through three monitoring levels, on a server-by-server basis. This configuration can be permanent, or can vary based on a schedule, and can always be overridden to diagnose a particularly interesting problem. ITCAM for WebSphere Problem-solving MethodologyThe usual starting point for solving a problem with an Enterprise deployment is the Enterprise Overview section. This display shows you, in graphical form, how many servers are active, the volume of throughput, and an indication of response time for your entire server farm. As shown above in Figure 2, ITCAM for WebSphere provides an intuitive drill-down approach to triaging performance issues to quickly determine root cause and take appropriate courses of action to implement a fix or workaround. This illustrates directly how to control known errors within production application environments. Drill-down ApproachFrom the Application Overview section, you can proceed directly to one of three more detailed views of any particular server group:
Lets you identify and act upon active threads (threads that have not finished executing). Useful if you expect that the problem transaction has not completed, and identifies the server running the problem application.
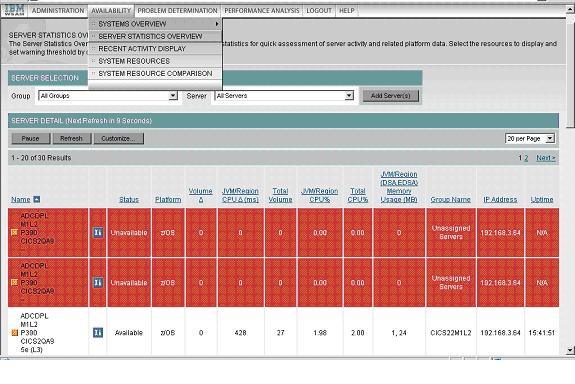
Provides automatically updated server availability metrics for each server in the group, like absolute and delta transactions volume, memory, and platform or CPU utilization. This is very useful to compare servers within a group in more detail, and to let ITCAM for WebSphere help you to identify poor performance metrics with visual cues.
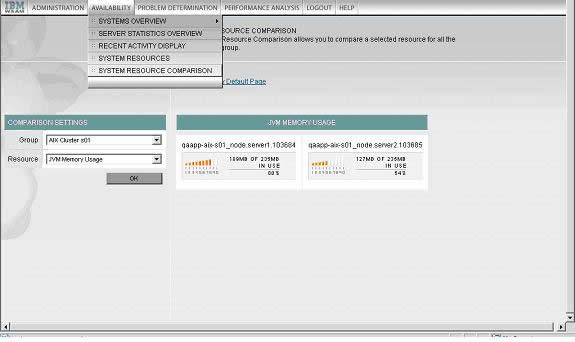
Compares resources for the servers in a group. Useful for investigating issues where one server among a group is behaving erratically.
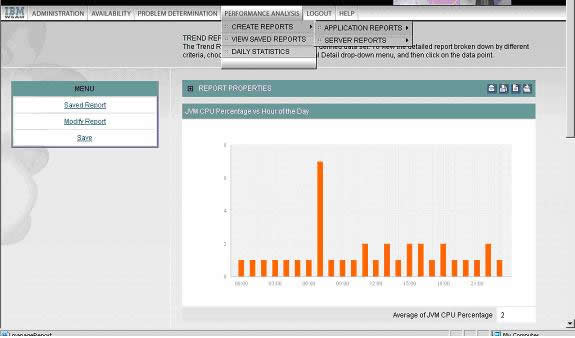
At any level of investigation, you are presented with links to the relevant next-step features. For example, from the Server Availability Detail page, after you identify a particular problem server, you can look at its resident threads in the Application Activity Display, look at its J2EE resource use in the System Resources Overview, or proceed to the System Resource Comparison. Continuous Monitoring: Traps and AlertsITCAM for WebSphere lets you monitor your servers automatically, allowing you to catch a particular behavior or event at the time it occurs, through its Trap & Alert Management capabilities. You can define traps to look for a specific event by name and type (HTTP or SQL), for a specific application behavior or metric, or for WebSphere performance metrics that reach or surpass defined thresholds. ITCAM for WebSphere lets you define the actions to take when a trap is triggered, which includes logging and e-mail. You can define the number of times that the trap condition must be met before ITCAM for WebSphere executes the trigger. Analysis-based MethodologyIn addition to the "real-time" use, you can define a variety of reports and charts from the archived data; for example, throughput by application group against time of day. Reports are useful both for capacity planning, resource optimization and problem determination.
For details on how to configure monitoring using ITCAM for WebSphere, consult the User Guide and Operator's Guide. For More InformationFor more information about this tool, click on the link for this tool at the top of this page. |
©Copyright IBM Corp. 2005, 2008. All Rights Reserved. |