| Tool Mentor: CAM WS - Overall View of a Problem in Problem Management |
 |
|
| Related Elements |
|---|
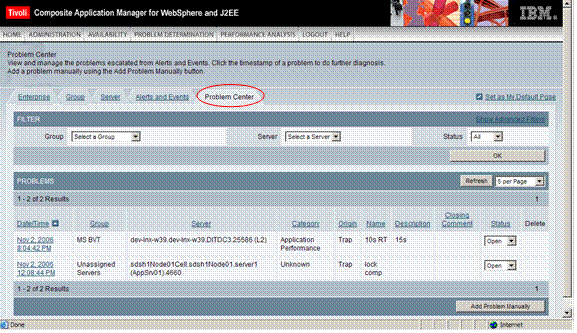
ContextTool mentors explain how a tool can perform tasks, which are part of ITUP processes and activities. The tasks are listed as Related Elements in the Relationships section. You can see the details of how processes and activities are supported by this tool mentor, by clicking the links next to the icons: DetailsThe "Problem Center" introduced in ITCAM for WS/J2EE v6.1 is a convenient way to get an overall view of the potential problems affecting your applications. It is accessed by clicking on the "Problem Center" tab on the home page of the product (Fig. 1).
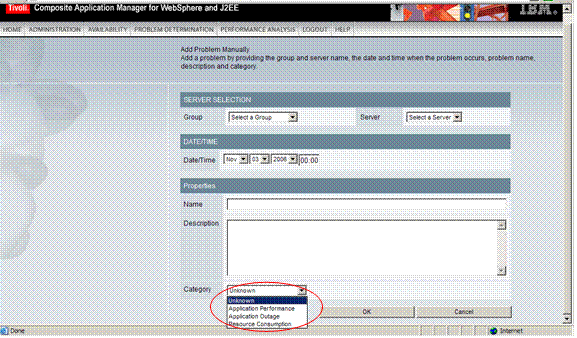
Problems are listed individually on the "Problem Center". The three leftmost columns identify the problems by date/time, and by the group and the server they were detected on. Depending on what triggered the problems, they are also classified into one of four different categories (4th column from the left): "Application Performance", "Application Outage", "Resource Consumption" and "Unknown". The list of problems is populated through the "Alerts and Events" mechanism, through TEMA situations, or through ITCAM for WebSphere®/J2EE’s own trap mechanism. This is reflected in the "Origin" column (5th column from the left). The user also has the option to add a problem manually, by clicking on the "Add Problem Manually" link on the lower right-hand side of the screen. This brings up a page where the user can enter the date/time, group, server, problem description, and name of the problem. A problem category can also be assigned (Fig. 2).
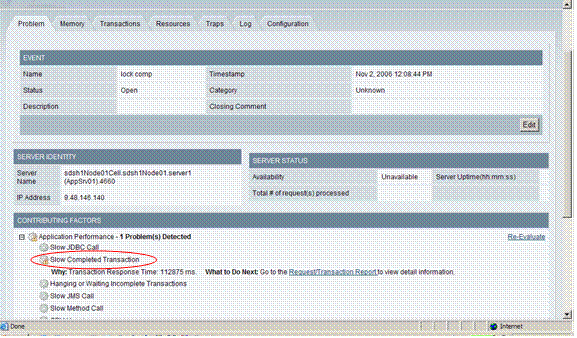
To drill down into the details of a particular problem, click on its link (leftmost column of the "Problem Center" page). This will bring up a page similar to Fig 3.
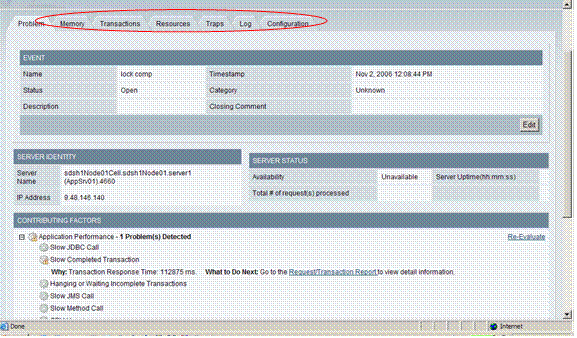
In the "Contributing Factors" section (Fig. 3), the user can see the different criteria that the tool has used to evaluate the problem: for example, JDBC calls, hanging transaction, JMS calls and Method calls have been examined by the tool and were deemed to not be the root cause since their alert thresholds have not been breached. The transaction did complete, although very slowly, and the next suggested step is to go to the Performance Analysis functions to obtain a "Request/Transaction Report". This report would contain detail information about this specific transaction, and allow for further in-depth analysis. The tabs on top of the page (Fig. 4) will display "contextual" information around the problem: what happened with the memory, transactions, system resources, etc when the problem occurred. Having this information handy is valuable when performing problem determination since the behavior of memory, related transactions and resource consumption can yield clues as to the root cause of the problem. Data is presented for a period of +/- 10 minutes (20 minutes total) from the time the problem occurred. This information can also be viewed from other tabs in the tool (for ex., Resource information would be obtained by going to the "Availability" tab on the top navigation, then drilling down to "System Resources"), but the Problem Center aggregates it and makes it easier to view.
For More InformationFor more information about this tool, click on the link for this tool at the top of this page. |
©Copyright IBM Corp. 2005, 2008. All Rights Reserved. |


