Context
Tool mentors explain how a tool can perform tasks, which are part of ITUP processes and activities. The tasks are listed as Related Elements in the Relationships section.
You can see the details of how processes and activities are supported by this tool mentor, by clicking the links next to the icons:
Details
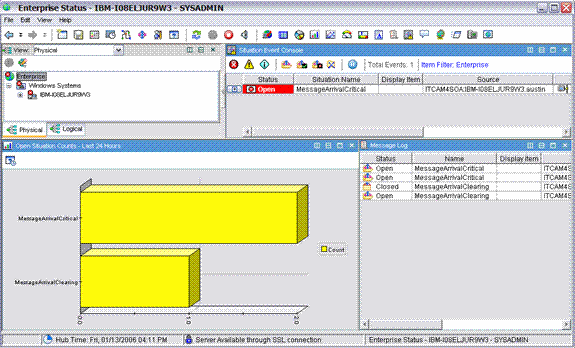
The IBM® Tivoli® Enterprise Portal component of ITCAM for SOA uses an enterprise console for all events (Situations).
Situations are represented by certain fields, such as event status (Open, Closed, Acknowledged or Re-Opened), situation
name, time stamp, event source and so on. This console provides the working queue of known problems that are reported
by the ITCAM for SOA agents to the IBM Tivoli Enterprise Portal.
The Enterprise view is used to process and acknowledge situations (independent of Tivoli Enterprise Console). It
provides the user with a status of the realm of known, agent-reported situations.
In order to demonstrate how to use ITCAM for SOA to investigate and diagnose an Incident, the section that follows
presents an example that involves a web service disruption caused by the size of message exceeding thresholds
previously set by an IT Operator. These thresholds could correspond to a formal, specified Service Level Agreement,
could pertain to an overall response time that is being tracked, etc.
In this example, the overall steps include:
-
Acknowledging the situation as it appears in the Enterprise View
-
Navigating to the ITCAM for SOA agent view and looking at status and expert help.
-
Launching the Web Services Navigator and further isolating web service
NAVIGATE TO THE PROBLEM AND ACKNOWLEDGE THE SITUATION
-
The Event Console (using the Enterprise View) shows an Exception (or Situation).
-
By clicking on the red "x" in the tree view on the upper left, we see the actual situations that are being
triggered, this situation shows that a web service is experiencing SOAP faults.
-
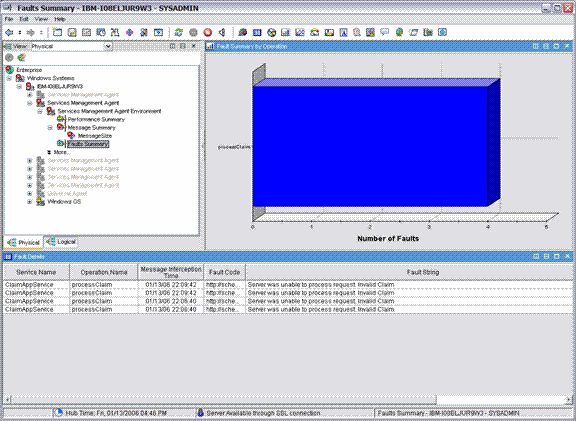
Navigate to the SOAP summary view to gain additional information and insight regarding the web services incident.
In this case we see a single web service experiencing several SOAP faults.
-
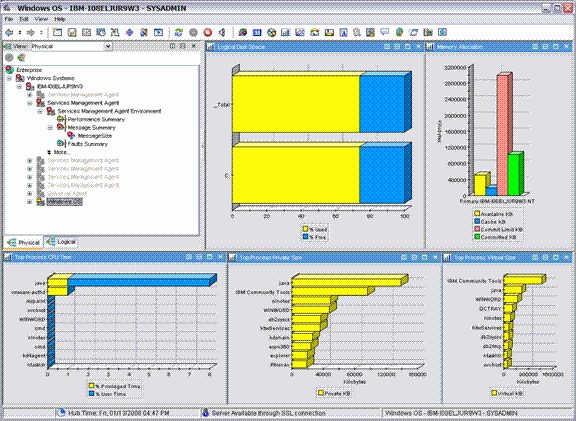
Navigate back to the operating system view, which can have additional workspaces of additional resources being
monitored. None of these resources are reporting problems or issues.
-
By right-clicking on the navigator, we can bring up a menu and choose Acknowledge situation
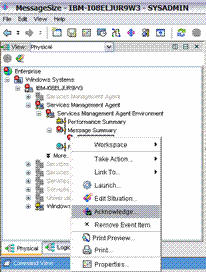
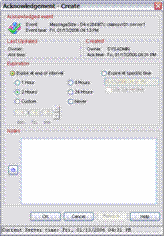
This brings up a dialog box that allows you to put information that the situation has been acknowledged, when
the problem is expected to be resolved, and any additional notes.
LAUNCH WEB SERVICES NAVIGATOR
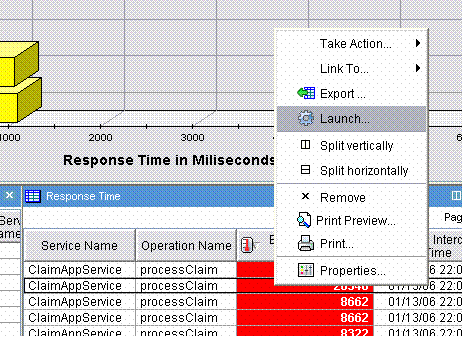
-
You can right-click on the SOAP Faults workspace to bring up the Launch menu item. It can be configured to add the
Web Services Navigator, which is an Eclipse®-based plug-in included in ITCAM for SOA for more detailed web services
views.
To add the Web Services Navigator, click on the Create New button, and fill out the Name field. Browse to the
directory where the Web Services Navigator is installed by clicking on the Browse button next to the Target
field. This will bring up a windows explorer view that allows you to navigate to the directory where the Web
Services Navigator is located. Once you find it, then the Launch Dialog will look like this:
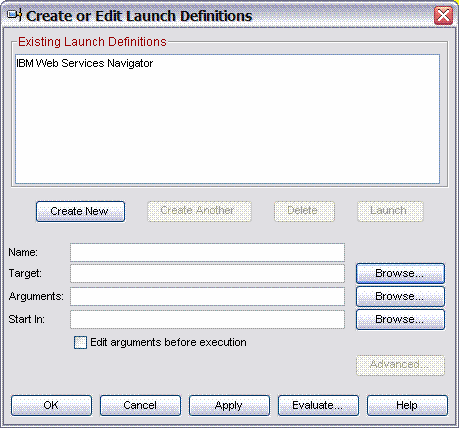
Highlight the IBM Web Services Navigator and hit the launch button (which won't be greyed out).
-
Launching the Web Services Navigator will bring up an Eclipse runtime.

-
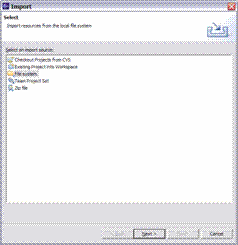
Once the Web Services Navigator is up, click on File->Import to bring up the log file for the server that is
hosting the web services causing the SOAP faults.
A wizard dialog box will pop up and guide you through the file importing process. Choose File System to begin..
-
Once the file has been imported there are 5 views that can be used to determine and diagnose the problem, Topology,
Sequence Diagram, Flow Patterns, Statistics and Message Content. Start with the Topology Perspective...
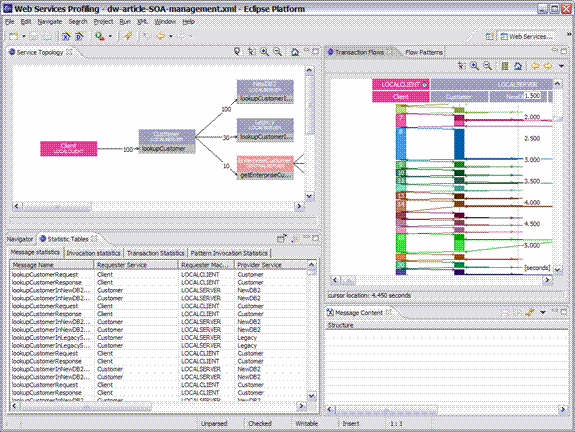
-
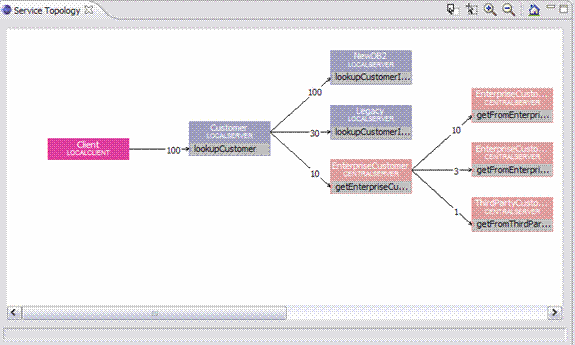
The Topology perspective shows us the relative relationships of service calls being made. In this case, the
topology view does not show anything unexpected
-
Open the sequence diagram view, and here we see that there are duplicate calls being made to each service
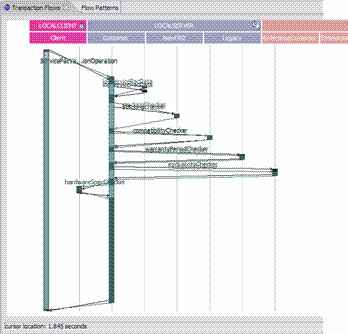
-
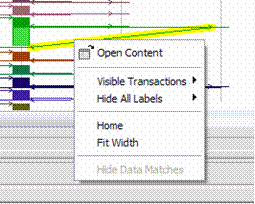
Right-clicking on one of the response bars brings up a dialog box. Choose View Content to bring up the content of
the response.
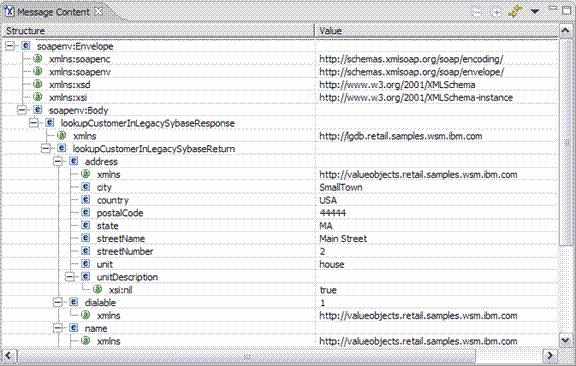
-
By viewing the responses of the duplicate calls, it seems that the duplicate calls are also causing errors in the
web service responses
-
We have determined that the cause of the error is coding in one particular web service which is making 2 outbound
calls, instead of 1, and is introducing errors in the responses.
For More Information
For more information about this tool, click on the link for this tool at the top of this page.
|
