Context
Tool mentors explain how a tool can perform tasks, which are part of ITUP processes and activities. The tasks are listed as Related Elements in the Relationships section.
You can see the details of how processes and activities are supported by this tool mentor, by clicking the links next to the icons:
Details
The IBM® Tivoli® Enterprise Console® 3.9 Web console has an option to provide Web-based help pages that can be used as a
method of identifying a quick workaround. Tivoli Enterprise Console 3.9 gives the ability to view more information
about an event in a Web page, which helps an operator to determine the actions to perform and whom to contact. When the
sample event information is installed, samples and hooks are provided to help you enable this feature. Customers must
provide the additional information to customize their environment.
If no quick workaround exists, the administrator on the Web console can view all the event details for the event as a
means to investigate the source of the event. The following passage from the Tivoli Enterprise Console 3.9 User
Guide explains how to view the event details and what can be seen. All current manuals can be located on the IBM
Web site in the Tivoli Information Center at http://publib.boulder.ibm.com/infocenter/tivihelp/v3r1/index.jsp?toc=/com.ibm.itec.doc_3.9/toc.xml.
To view the details:
Details about events are called properties. To display event properties, choose one of these methods:
-
Select the appropriate event in the event viewer and click Properties on the tool bar.
-
Click on the severity in the Severity column of the event viewer for the appropriate event.
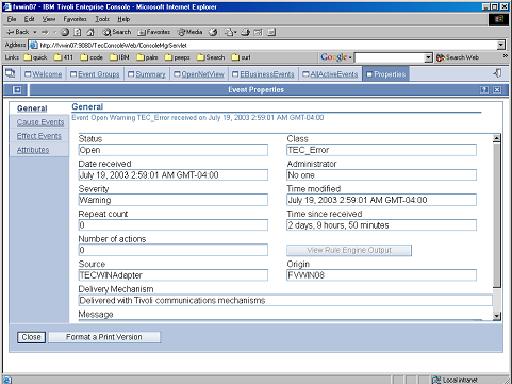
An event properties notebook is displayed that contains the following pages:
General
Displays general information about the selected event, such as status and date received. If a rule has
automatically responded to the event (the event status is RESPONSE), you can view the rule engine output. To do
this, click View Rule Engine Output on this page. The results are shown in a new window of your Web browser.
Cause Events
Displays the cause events of the selected event when you click Show Cause Events. The cause events are listed in a
table. To manage one or more cause events, select the events and then select Manage Events from the table menu. An
event viewer is opened for the selected events.
Effect Events
Displays the effect events of the selected event when you click Show Effect Events. To manage one or more effect
events, select the events and then select Manage Events from the table menu. An event viewer is opened for the
selected events.
Attributes
Displays the attributes of the selected event. If you want to print the event properties, click Format a Print
Version on any page of the event properties notebook. The formatted version of the event properties is shown in a
new window of your Web browser. Use the print option of your Web browser to print the event properties.
In addition to the Web console, Tivoli Enterprise Console 3.9 also has a Java™ console the can be used to view and
investigate events. The Java version of the event console provides the following views:
Configuration view
The Configuration view is used to configure both the Java version and the Web version of the event console. Only
administrators have access to this view.
Summary Chart view
The Summary Chart view is used to show a high-level overview of the health of resources represented by an event
group. Each event group is represented by a single bar, similar to a bar graph, on an operator's event console. To
open an event group, click the bar representing that group.
Priority view
In the Priority view, event groups are represented by buttons. The buttons representing each event group display
the event group name and the color of the button representing each event group corresponds to the color defined for
the highest severity event contained in that group. To open an event group, click the button representing that
group.
The event group view is where an operator would look to see significant events. Events are color coded on this
screen and the operator can open individual events to understand the event details. The following picture shows the
event details from the Java console.
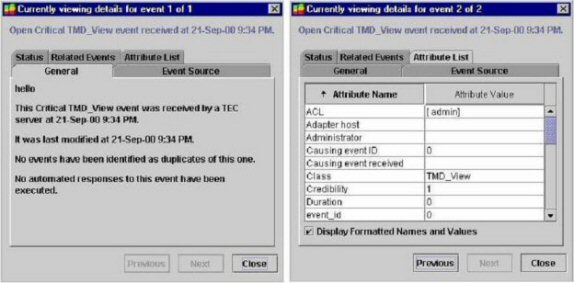
Figure 1: Event details in the Java Console
For More Information
For more information about this tool, click on the link for this tool at the top of this page.
|
