| Tool Mentor: TNO - Investigate and Diagnose Incident |
 |
|
| Related Elements |
|---|
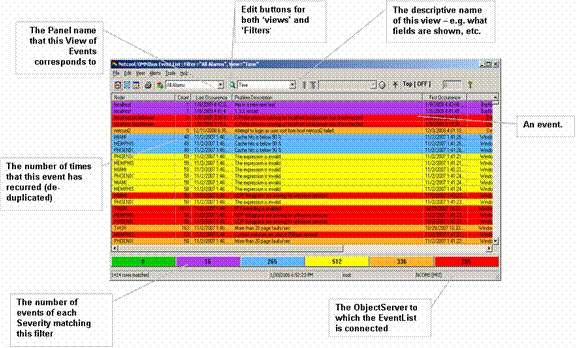
ContextTool mentors explain how a tool can perform tasks, which are part of ITUP processes and activities. The tasks are listed as Related Elements in the Relationships section. You can see the details of how processes and activities are supported by this tool mentor, by clicking the links next to the icons: DetailsThe IBM® Tivoli® Netcool/OMNIbus product is configurable to include a range of context sensitive tools supporting the Operator in the management of Incident Reports. The tools may include links to documentation usually web based giving guidance on process and clearance of the Incident. When integrated with an external Help Desk system as described in tool TNO - Identify and Log Incident the bi-directional interface allows the update of Status and Resolution information to be applied in both systems. A single right click tool may launch a complex script executing a series of actions against the device to provide diagnostic information. Within OMNIbus Events and Incidents are managed using the same common database and User Interface. Filtered views are constructed by the Administrator and authorized Users that may be used to view and manage related Events and Incidents from a single User Interface. An Incident may be either an existing Event that has been identified as an Incident, or a newly created Incident identified by correlation from a series of events. A single record consists of 26 standard fields including, for example, affected Node or Device, repeating event count and Problem description or Summary:
The underlying ObjectServer schema can be modified to provide additional information as required. The event may be structured to common standard forms for example x733. All fields of the Incident can be shown, but it is more likely to show only those fields which are important to an operator at first glance. A pull-down list is available to display all fields in a selected Incident. The configurable filters and Views in the user interface known as the "Event List" provides the operator with a personalized view of the active Incidents, together with a range of customizable tools supporting alarm management.
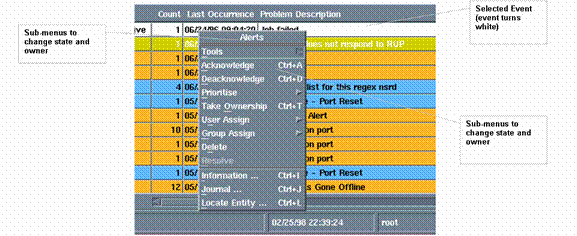
Incidents can be ordered and re-sorted by operator interaction. Incidents can be selected, acknowledged, assigned to, re-prioritized, and deleted (if the user has the correct authorization privileges). The scroll bars allow full Incident information to be viewed. You can scroll down through all the alarms in the system. If you use the horizontal scroll bar at the base of the event list, you can see the complete set of information available for each alarm. The Summary bar, located below the horizontal scroll bar, shows the total number of Incidents by severity that match the filter for this view. Clicking on a severity causes a temporary additional filter to be applied to limit the view to the Incidents of the selected severity. An All Events button is activated on the bar, enabling a return to the 'All events for this filter view. An alerts menu provides a context-sensitive set of functions that may be further customized by the administrator.
The default menu options are summarized below:
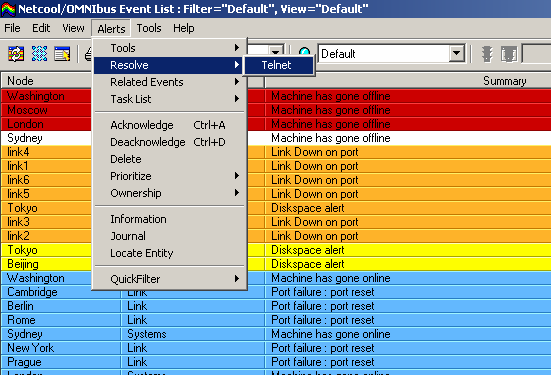
All these functions are automatically 'journalized' in the system, with the date, time, and operator who changed the function. This provides an audit trail of what happens to an Incident automatically. In addition, each of the menu functions is user access controlled. The following snapshot shows an example of a view illustrating the use of a "point and click" menu item linking to a Telnet tool which will attempt to connect to the device identified by the selected Incident related Event.
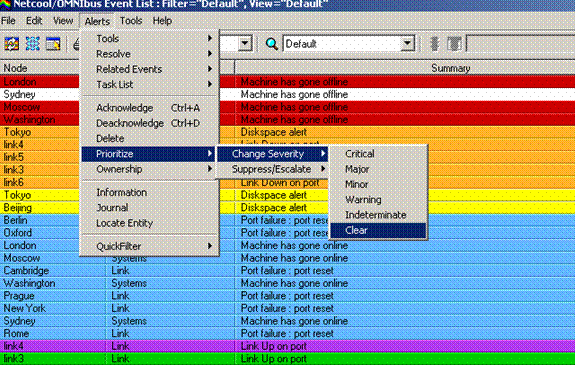
The Operator is then able to take corrective action via the Telnet session before Clearing or Escalating the Incident as appropriate. Netcool/OMNIbus tools can be configured to give operational staff a wide range of context sensitive right-click tools including integration with a knowledge base typically by URL and shows details of how to resolve a specific problem based on an alert received in Netcool. Successful corrective action will frequently result in the generation of a resolution event which will "Clear" the Incident through the automation system. The Operator may also manually "Resolve" the Incident by use of the Change Severity tool setting the status to "Clear" as illustrated in the snapshot below.
When integrated with an external Help Desk system Netcool/OMNIbus provides the ability to open, update, and notify the trouble ticket system to close the ticket. Similarly, Netcool can receive updates and notification to clear the event from the trouble ticket system. Severity, priority, assigned to, and others are typical data elements exchanged between Netcool and the trouble ticket system. For More InformationFor more information about this tool, click on the link for this tool at the top of this page. |
©Copyright IBM Corp. 2005, 2008. All Rights Reserved. |