| Tool Mentor: CAM RTT - Monitor and Report Service Level Achievements |
 |
|
| Related Elements |
|---|
ContextTool mentors explain how a tool can perform tasks, which are part of ITUP processes and activities. The tasks are listed as Related Elements in the Relationships section. You can see the details of how processes and activities are supported by this tool mentor, by clicking the links next to the icons: DetailsUnderstanding the end-user experience enables you to measure and monitor the level of service that you are delivering to your customers. Ultimately, it's end users that fund IT departments, and so it's critical to ensure the delivery of satisfactory service to those end users. With transaction-based management in IBM® Tivoli® Composite Application Manager for Response Time Tracking, you can measure and report the level of service delivered to the end user, and provide data to IBM Tivoli Service Level Advisor, so that it can be used to track the compliance with service level agreements between IT and the business. These reports provide a definitive basis for discussion with the lines of business on the value, performance and cost of IT service that is being delivered. IBM Tivoli Composite Application Manager for Response Time Tracking uses two basic methods to capture the end-user view of transactions:
It's very important to combine both the active and passive monitoring techniques, in order to get a full picture of the level of service being delivered. Active monitoring is the only way to truly measure the availability of the business transaction at the end user: does the transaction work or not? IBM Tivoli Composite Application Manager for Response Time Tracking allows you to configure thresholds on your monitoring policies and provides different reports and event notifications on violation conditions. Event responses such as e-mail notification and script execution enable not only the communication of the information but also allow you to take automated actions in the case of an incident or a failure. You can also choose to create an event in the Tivoli Enterprise Console (TEC). We'll now take a look at each of these capabilities. First, the active monitoring techniques that can monitor the availability and performance delivered to the end user:
The passive monitoring technologies monitor the response time for real transactions, using a variety of implementation points:
To set up and configure monitoring, you install a Management Agent on the machines that you want to monitor your applications on. Then, you deploy the monitoring component - Generic Windows, Synthetic Transaction Investigator, Quality of Service or Generic ARM - that caters to your monitoring requirement. Finally, you set up monitoring policies with thresholds and event responses to monitor the service. As an example, consider the shopping cart application of an online store. You want to monitor the operation to ensure service delivery. The IT infrastructure consists of a browser-based Web client, and a WebSphere® Application Server. Before you begin to configure monitoring, install a Management Agent. Also install the STI recorder and monitoring component on a desktop client machine.
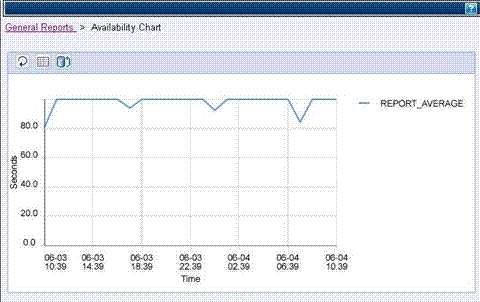
After the policy is distributed to the agents, the transaction is played back at the associated schedule, and monitoring information is collected as the transaction passes through the application server. You can configure thresholds after you monitor your transactions to get an idea of the normal response times to determine violation levels. For more details on how to configure monitoring using IBM Tivoli Composite Application Manager for Response Time Tracking, refer to the Administrator's Guide. IBM Tivoli Composite Application Manager for Response Time Tracking provides the following key reports that help you monitor and understand service levels.
Additionally, the data can be forwarded to IBM Tivoli Service Level Advisor, so that it can be used to track the compliance with service level agreements between IT and the business. For detailed information on the reporting features of IBM Tivoli Composite Application Manager for Response Time Tracking, please refer to the Operators Guide. For More InformationFor more information about this tool, click on the link for this tool at the top of this page. |
©Copyright IBM Corp. 2005, 2008. All Rights Reserved. |
