| Tool Mentor: CAM RTT - Investigate and Diagnose Incident |
 |
|
| Related Elements |
|---|
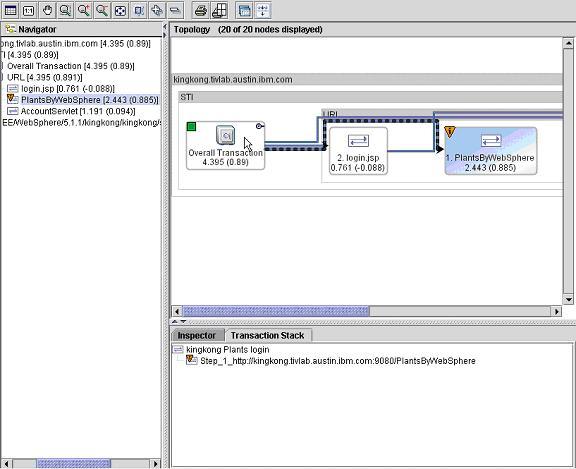
ContextTool mentors explain how a tool can perform tasks, which are part of ITUP processes and activities. The tasks are listed as Related Elements in the Relationships section. You can see the details of how processes and activities are supported by this tool mentor, by clicking the links next to the icons: DetailsIBM® Tivoli® Composite Application Manager for Response Time Tracking allows you to measure the performance and availability of your user transactions. Transaction-based measurement, as opposed to resource-based measurement, aligns the IT with the business processes it supports. Transaction-based management measures performance and availability from an end-user perspective, identifying the location of an issue and helping you fix it. IBM Tivoli Composite Application Manager for Response Time Tracking helps you investigate and diagnose a problem quickly by providing you with a decomposition-view of the transactions in your IT system. Visualizing transactions in a topology context helps you understand the flow of transactions and pinpoint the problem. The node with the worst failure status is automatically expanded with path highlighting, both for aggregate and for instance data. For more information on navigating and understanding the topology report, refer to the Operations Guide. The Dashboard provides you with a high-level summary of the transactions being monitored. There are three levels of the dashboard - policy groups, policies, and policies by agent. You can drill deeper from one level to another, and at the lowest level, you can view topology or event-specific information. For more information on how to define and create policy groups, refer to the Administrator's Guide. The Fast Path to Failure view on the Dashboard identifies the root cause of the problem. Fast Path to Failure takes you to the worst performing node in your transaction topology for the selected transaction. You can get to the Fast Path to Failure feature from all levels of the dashboard. For more information on the Fast Path to Failure feature, refer to the Operations Guide.
For example, if the network is the problem, that network link will be highlighted, to help you diagnose the problem more quickly. IBM Tivoli Composite Application Manager for Response Time Tracking communicates any problem conditions - performance threshold violations and availability threshold violations using its event sub-system. The event views provide event annotation about the specifics of the problem encountered. Events can also be associated with actions such as e-mail notification and script execution - actions that are executed when a violation condition occurs. IBM Tivoli Composite Application Manager for Response Time Tracking also integrates with the IBM Tivoli Enterprise Console® to centralize event notification and action processing. Discovery policies allow you to automatically discover the transactions that are running within your application. This process helps you judiciously select monitoring candidates thereby measuring those transactions that are part of the end-user experience. After discovery, you can select any transaction, or a group of them, to monitor. Listening policies allow you to sample a percentage of your transactions in your live production environment. When an incident is reported, you can increase the sampling and also increase the level of monitoring to capture more contextual information that is relevant to the incident. The components that are categorized as listening include J2EE, Web Services, Generic ARM and Quality of Service. Playback policies play back transactions in a controlled manner that simulates the user experience. The components categorized as playback include Synthetic Transaction Investigator (STI) and Generic Windows. For example, consider the shopping cart application of an online store. The incident was reported on the slow response time of the checkout process. The IT infrastructure consists of a browser-based Web client, a WebSphere® Application Server, and a DB2 database on the back-end. Before beginning to configure monitoring, install a Management Agent and then deploy the J2EE monitoring component on the machine with the Web application server. First, select which transactions to monitor. To do so, create a discovery policy using the following steps:
Next, create a listening policy to monitor any transactions of interest. Monitor the transaction that the incident is reported on as shown:
After the policy is distributed to the agent, and it runs, we can use the Dashboard, Fast Path to Failure, and Component Events features to isolate and diagnose the incident. For more details on how to configure monitoring using IBM Tivoli Composite Application Manager for Response Time Tracking, refer to the Administrator's Guide. In summary, when a problem is encountered, if you don't already have a monitoring policy for the application or transaction, you first create one. After you have done so, you can turn on monitors as needed to delve deeper into the problem context and use the above features to quickly investigate and diagnose the incident. For More InformationFor more information about this tool, click on the link for this tool at the top of this page. |
©Copyright IBM Corp. 2005, 2008. All Rights Reserved. |