| Tool Mentor: TSLA - Monitor, Analyze and Report Availability |
 |
|
ContextTool mentors explain how a tool can perform tasks, which are part of ITUP processes and activities. The tasks are listed as Related Elements in the Relationships section. You can see the details of how processes and activities are supported by this tool mentor, by clicking the links next to the icons: Details
IBM® Tivoli® Service Level Advisor provides the ability to analyze and report on availability of services and to see
potential problems in the overall environment. The violation data shown for each SLA can uncover service availability
issues. To view an overall report, for all SLAs that are grouped by Customer, simply log into the web-based SLA report
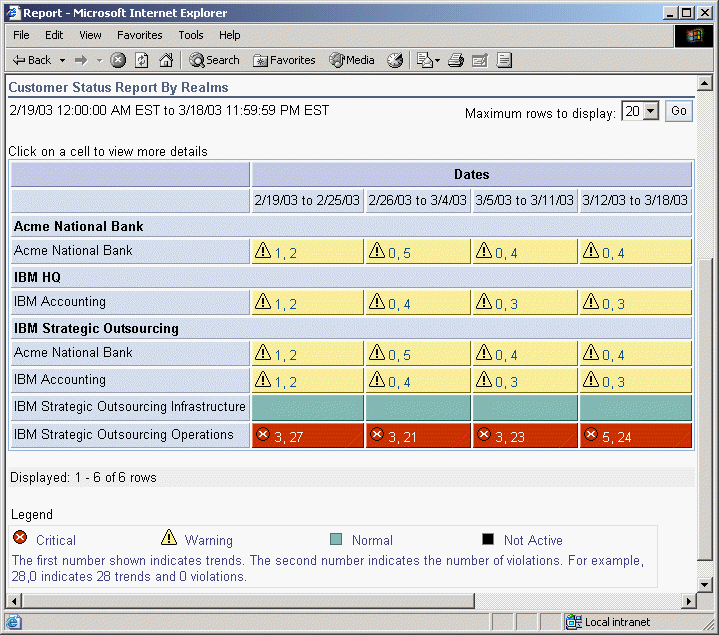
management console by specifying the name at In the above Web address, <report_server> is the fully qualified name of the machine where the SLM Server is located, such as myMachine.raleigh.ibm.com, and <port> is a valid port number (you can usually leave the port number unspecified to just use the default value of 80). For example: http://myMachine.raleigh.ibm.com/SLMAdmin The first view of report data that the user sees is in the form of a high-level status report, which gives the users an overall summary look at the status of the orders in which they are interested. There are two views of high-level status reports available, depending on the type of users who are signing on to the Web site:
Clicking on a high-level report cell displays an Overall Report view, which shows additional information about the data that was collected during that report period. Using the Report Type menu, the user can select one of several additional views that display more information about the report data. Breaches and trends are immediately noticeable through the color-coding of SLAs. Yellow cells mean the SLAs are in a warning state and red cells mean the SLAs have already crossed their critical thresholds. These thresholds are set in the Reporting Interface. The numbers next to the warning or critical symbol are the number of trends and violations, respectively, for that SLA . For more information about that specific SLA for a specific time period, simply click the cell or the numbers provided. The violation information, specifically, can be used to determine service availability. The data shown by the drill down method can be used as the service metric data that is required by many Service Management processes. This detailed data shows the availability data that different components of the system report to SLA . The time period and specific metric can also be used to return to the application that is gathering the data and comparing the instance reporting that is provided by that application to the SLA reporting in Tivoli Service Level Advisor. Detailed data about specific availability issues can be seen by returning to the gathering application. Various types of availability data are accessible to Tivoli Service Level Advisor from many Tivoli monitoring products. Examples of these products include IBM Tivoli Monitoring and IBM Tivoli Enterprise Console®. These source applications feed their data into the Tivoli Data Warehouse using an ETL (Extract, Transform, and Load) procedure. Tivoli Service Level Advisor then uses its own ETL procedures to read this data out of the Data Warehouse and make it available for report generation and analysis by Tivoli Service Level Advisor. See the Administrator's Guide for IBM Tivoli Service Level Advisor Version 1.2.1 and the IBM TSLA Best Practices Document - Service Level Management for Web Applications for more information. For More InformationFor more information about this tool, click on the link for this tool at the top of this page. |
©Copyright IBM Corp. 2005, 2008. All Rights Reserved. |
