| Tool Mentor: TSLA - Evaluate Service Level Management Performance |
 |
|
| Related Elements |
|---|
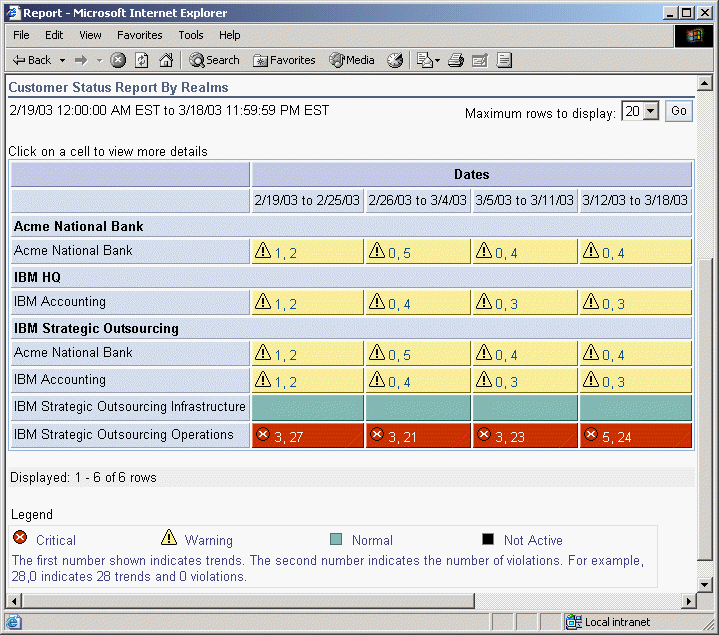
ContextTool mentors explain how a tool can perform tasks, which are part of ITUP processes and activities. The tasks are listed as Related Elements in the Relationships section. You can see the details of how processes and activities are supported by this tool mentor, by clicking the links next to the icons: DetailsIBM® Tivoli® Service Level Advisor provides the ability to analyze and report on availability of services and to see potential problems in the overall environment. The violation data shown for each SLA can uncover service availability issues. To view an overall report, for all SLAs grouped by Customer, simply log in to the Web-based SLA report management console at: http://<report_server>:<port>/SLMReport The first view of report data that the user sees is in the form of a high-level status report, which gives the users an overall summary of the status of the orders in which they are interested. There are two views of high-level status reports available, depending on the type of user signing on to the Web site:
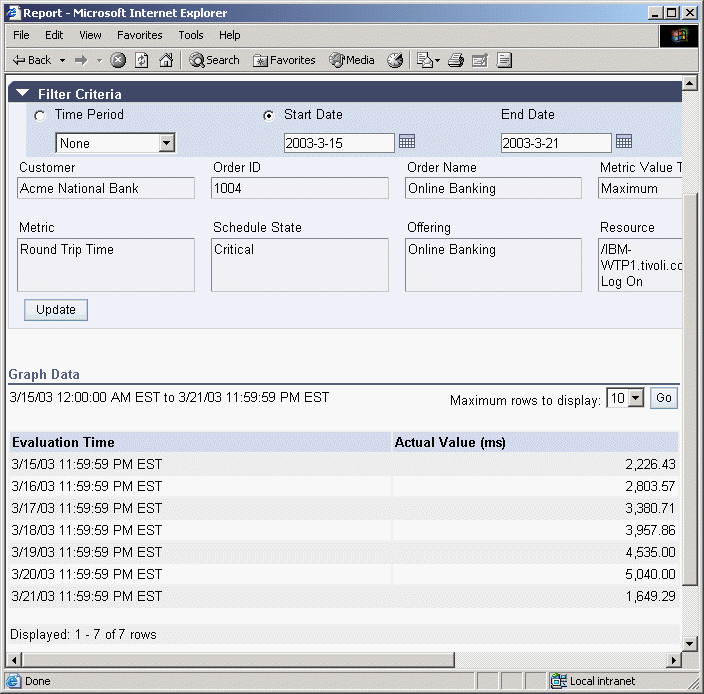
Clicking on a high-level report cell displays an Overall Report view, which shows additional information on the data that is collected during that report period. Using the Report Type menu, the user can select one of several additional views that display more information about the report data. It is easy to measure the effectiveness of an improvement plan using Tivoli Service Level Advisor. Simply view reports from before the improvement plan and after the improvement plan to see the differences in measurements. This view also gives you the ability to view specific data points for those graphs in order to compare the results numerically. Instead of selecting from a predefined set of time periods, specify a particular start and end date for your report that represents a period of time before the improvement plan. Click the Start Date radio button and enter the desired start and end dates in the Filter Criteria fields provided. Note that you can enter the date directly into the fields, or select the calendar icon to the right of each field to navigate to the desired date and select it from the calendar. If you enter the date manually, it must be in the ISO format, year-month-day, for example, 2002-12-31 . In a separate window, perform the same task using dates after the improvement plan. When you have entered your desired start and end dates for the report, click Update to refresh the report view. To see the actual data points that were used to construct the graph, you can click the View Data Web link below the graph, which displays the actual measurement data behind the graph data, for your reference. Figure 2 shows an example. These reports can also be printed to ease the comparison process.
See the Administrator's Guide for IBM Tivoli Service Level Advisor Version 1.2.1 and the IBM TSLA Best Practices Document - Service Level Management for Web Applications Version 1.2.1 for more information. For More InformationFor more information about this tool, click on the link for this tool at the top of this page. |
©Copyright IBM Corp. 2005, 2008. All Rights Reserved. |

