| Tool Mentor: TNM – Deliver Service |
 |
|
| Related Elements |
|---|
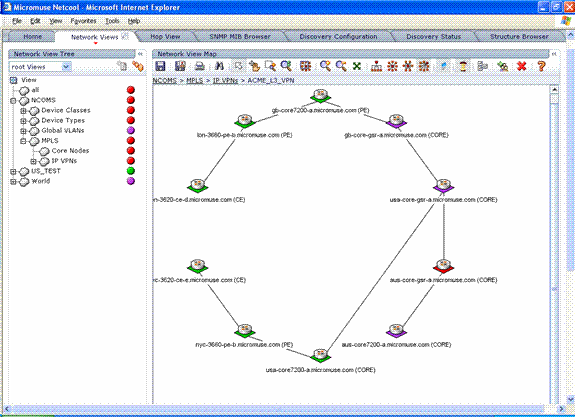
ContextTool mentors explain how a tool can perform tasks, which are part of ITUP processes and activities. The tasks are listed as Related Elements in the Relationships section. You can see the details of how processes and activities are supported by this tool mentor, by clicking the links next to the icons: DetailsTo deliver a service reliably and in a timely manner, a network operator must have up-to-date information on the configuration of the network, and tools to monitor service delivery and ensure service availability. IBM® Tivoli® Network Manager (TNM) includes a Web-based network topology visualization tool to help users understand how the network is currently configured and what services are supported by that network. The network visualization GUI uses the discovered network topology information and event information to generate graphical maps of the network topology around particular devices. Later, the maps can be sent to Web clients on demand. Views can be filtered to display services of a particular type or for a particular customer, including layer 3 IP VPNs and layer 2 pseudo wires.
The alarm state of each device delivering a service is displayed in all network views and represents the highest severity alarm state (significant events) on the device. Operators can drill down on specific problems in the Tivoli Netcool OMNIbus Webtop event list to locate the alarmed device in the network topology view, or show a list of all outstanding alarms on a selected device in the network topology view. TNM also supports polling network devices to proactively identify problems in the network, which can affect service delivery. This is required because in IP networks event delivery is not standard and not guaranteed. Refer to the tool mentor TNM – Detect and Log Event for additional details. For more informationFor more information about this tool, go to the IBM Tivoli Network Manager page. |
©Copyright IBM Corp. 2005, 2008. All Rights Reserved. |
