| Tool Mentor: TSLA - Analyze and Report Service Execution Operations |
 |
|
| Related Elements |
|---|
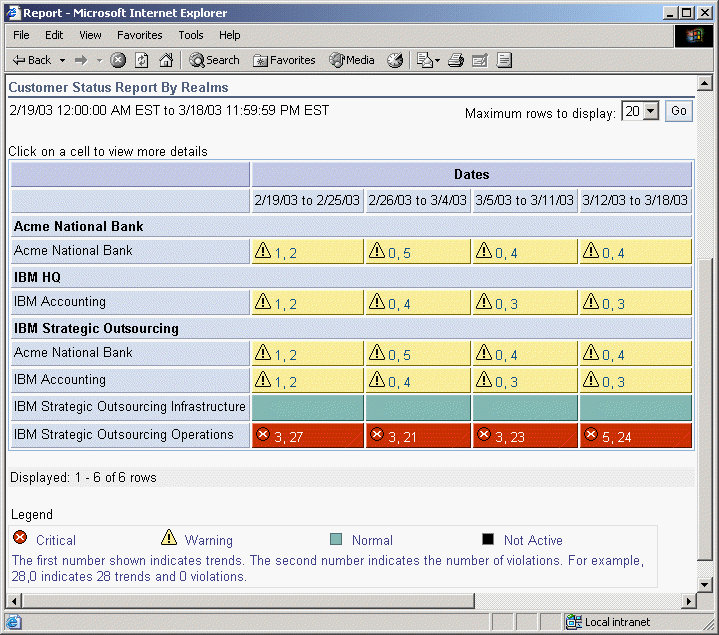
ContextTool mentors explain how a tool can perform tasks, which are part of ITUP processes and activities. The tasks are listed as Related Elements in the Relationships section. You can see the details of how processes and activities are supported by this tool mentor, by clicking the links next to the icons: DetailsMonitoring Service Levels for potential problems is important for protecting against breaches of agreements. IBM® Tivoli® Service Level Advisor provides trending reports for potential breaches, and also shows the levels within which each service is performing. Tivoli Service Level Advisor uses a drill-down approach to SLA management. To view an overall report, for all SLAs grouped by Customer, simply log into the Web-based SLA report management console at: http://<report_server>:<port>/SLMReport The first view of report data that the user sees is in the form of a high-level status report, which gives the viewer an overall summary look at the status of the orders in which they are interested. There are two views of high-level status reports available, depending on the type of user signing on to the Web site:
Clicking on a high-level report cell displays an Overall Report view, which shows additional information on the data that is collected during that report period. Using the Report Type menu, the user can select one of several additional views that display more information about the report data. Breaches and trends are immediately noticeable through the color-coding of SLAs. Yellow cells mean the SLAs are in a warning state and red cells mean the SLAs have already crossed their critical thresholds. These thresholds are set in the Reporting Interface. The numbers next to the warning or critical symbol are the number of trends and violations, respectively, for that SLA. For more information about that specific SLA for a specific time period, simply click on the cell or the numbers provided. This trend and violation information can be used to determine if an intervention is needed, and, if so, which method needs to be used. The data shown by the drill down method can be used as the service metric data that is required by many Service Management processes. The time period and specific metric can also be used to return to the application that is gathering the data and comparing the instance reporting that is provided by that application to the SLA that is reporting in Tivoli Service Level Advisor. This capability gives a complete view of what might have been happening, and also allows for more detail into the problem and its resolution. See the Administrator's Guide for IBM Tivoli Service Level Advisor Version 1.2.1 and the IBM TSLA Best Practices Document - Service Level Management for Web Applications for more information. For More InformationFor more information about this tool, click on the link for this tool at the top of this page. |
©Copyright IBM Corp. 2005, 2008. All Rights Reserved. |
