| Tool Mentor: NetView - Deliver Service |
 |
|
| Related Elements |
|---|
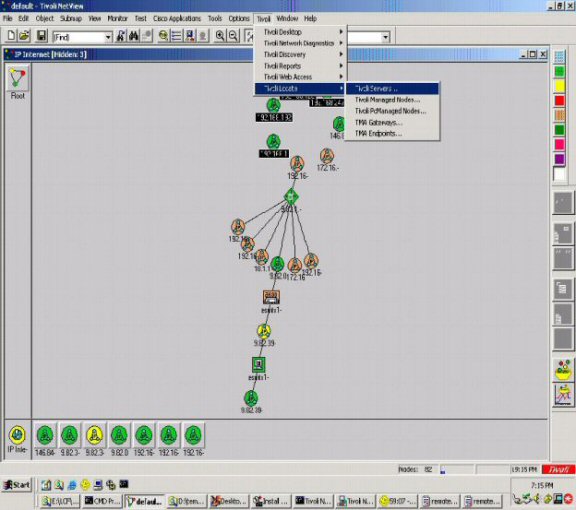
ContextTool mentors explain how a tool can perform tasks, which are part of ITUP processes and activities. The tasks are listed as Related Elements in the Relationships section. You can see the details of how processes and activities are supported by this tool mentor, by clicking the links next to the icons: DetailsIn addition to standard protocols, network management applications require standard ways to describe and interact with the resources that they manage. To avoid specifying the implementation of every device in a network to manage applications, an object-oriented approach is used. These objects are represented in NetView® with symbols that appear on the IBM® Tivoli® NetView GUI. The viewing of the GUI is but one way that NetView is used to monitor systems and services.
SNMP network management is based on the familiar client-server model that is widely used in Transmission Control Protocol/Internet Protocol (TCP/IP)-based network applications. Each managed host runs a process called an agent. The agent is a server process that maintains the Management Information Base (MIB) database for the host. Hosts that are involved in network management decision-making can run a process called a manager. NetView is one such manager. NetView is a client application that generates requests for MIB information and processes responses. In addition, NetView can send requests to agent servers to modify MIB information. Key ConceptsEventsEvents are messages about what is happening on the network. Tivoli NetView can send events when it discovers changes in the network or when an SNMP trap is received from a managed node. TrapsTraps are unsolicited messages from managed nodes in the network. They are generated by SNMP agents for network devices and sent to inform Tivoli NetView of changes on the agent systems. Unsolicited traps are sent to this management station only if the SNMP agents have been configured to do so. There are many products that can send traps to NetView. NetView can query any program that can generate SNMP traffic whether the node itself supports SNMP or it merely relays its information to an SNMP proxy. IBM Tivoli NetView receives information, in the form of traps from many sources on the network and relates the information through the console and its integration with Tivoli Enterprise Console. There is a component of NetView that is set up to facilitate the monitoring of individual applications on nodes. This component requires some configuration of NetView and the creation of some configuration files. The service monitor configuration file specifies the following information:
NetView creates events based on the reception of information from the network devices and services that indicate changes in the status of these resources. These changing network conditions can directly impact the services provided in the enterprise. Some of the conditions that cause an event to be generated are listed here:
Network operators monitor the status of nodes in the network as well as monitored services through the submaps of the NetView GUI. By focusing on a high-level map, changes in the status of these nodes and resources use color changes and the operator is able to drill down using clicks to find the exact resource that is most directly responsible for the change in conditions. NetView is able to send its information to Tivoli Enterprise Console for processing and therefore eliminates most of the need for the monitoring of the NetView GUI. It is very common, however, for the NetView display to form the central focus for a network management facility situation room whether or not events are primarily focused on using the NetView console. In addition, through the integration with Tivoli Enterprise Console, NetView is able to provide network information to correlate against existing enterprise events to help monitor services. An example is where the NetView can be consulted within the Tivoli Enterprise Console Rules engine to determine if all existing network paths to a given machine that are providing a service are down, thereby disrupting the service. In providing this value-add data, administrators can be properly alerted to the fact that router xxx.xxx.xxx.xxx is down instead of the North American database server being down, which can help them get the right teams to solve the problem more quickly. The integration of Tivoli Enterprise Console and NetView also permits the launch of the NetView console in the context of the event received at Tivoli Enterprise Console, which facilitates a closer look at service events by providing additional information for the administrator who is investigating the compromise of a service. The administrator is automatically brought to a network map in the NetView console that corresponds to the host of the Tivoli Enterprise Console event. For More InformationFor more information about this tool, click on the link for this tool at the top of this page. |
©Copyright IBM Corp. 2005, 2008. All Rights Reserved. |