| Tool Mentor: TPC – Deliver Service |
 |
|
| Related Elements |
|---|
ContextTool mentors explain how a tool can perform tasks, which are part of ITUP processes and activities. The tasks are listed as Related Elements in the Relationships section. You can see the details of how processes and activities are supported by this tool mentor, by clicking the links next to the icons: DetailsToday, industry needs storage management in open environments for the same reasons that storage management was needed in the mainframe environment in the early and mid-1980s. Businesses are generating data so fast that data storage and data management capabilities are being overwhelmed. If these capabilities cannot handle the growth, then at some point, the next transaction cannot be captured, and the business will stop. Here are two key problems that impact this situation:
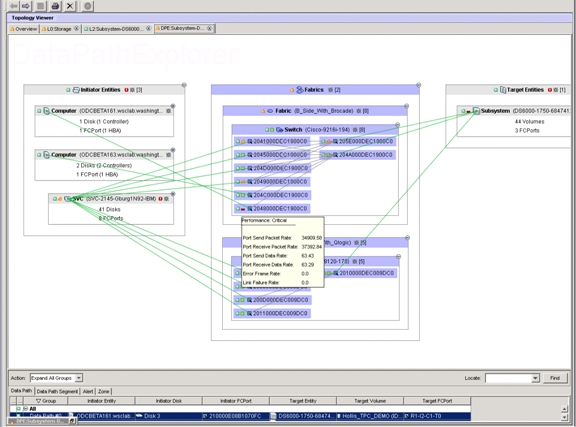
Storage Area Networks (SANs) are increasingly prevalent, but they now face the same problems found in traditional IP networking in the 80s. Two of the key challenges for SANs are to standardize and provide functional, open management tools. IBM® TotalStorage® Productivity Center (TPC) for Fabric is a standards-based solution for managing heterogeneous SANs. It is a comprehensive solution that discovers, monitors, and manages all your SAN fabric components. Because it is architected to common industry standards, TPC for Fabric allows you to choose best-of-breed hardware products for your storage infrastructure. By performing a SAN topology discovery and rendering the components and storage resources, TPC for Fabric enables administrators to validate the intended connections between systems and storage devices such as disks and tapes. As soon as TPC for Fabric is installed and configured, it can provide automated device discovery, topology rendering, error detection and fault isolation, zone control, real-time monitoring and alerts, link performance management, and event management for heterogeneous enterprise SAN environments. TPC for Fabric is designed to help simplify storage management and improve the availability of the SAN environment. Moreover, TPC for Fabric can provide automatic device discovery and allows multiple SAN views, including physical, logical, and zone views. Because administrators are able to gather configuration, network statistics, and other status information from switches, they can view and analyze multiple aspects of the storage environment, including capacity, utilization, assets, and availability. Administrators can use this information to determine which systems, for example, are approaching maximum capacity and which systems are near minimums, so that they can perform load balancing as needed. TPC for Fabric monitoring capability is designed to detect storage events and generate the appropriate alerts to the administrator. TPC for Fabric also is designed to provide a number of SAN availability features, including SAN error protector. An autonomic computing capability, SAN error predictor is designed to help predict SAN network problems before they become severe and impact data and application availability. This functionality incorporates predictive failure analysis into the storage network environment, designed to allow administrators to be proactive in managing SAN availability. In this figure, it provides an overview of a SAN segment. If any icon color is not green, it means something is not normal in the SAN environment.
TPC for Fabric also gives you the ability to view events that are happening in your SAN environment and records state changes. The events are displayed in a color-coded fashion and can be further customized to reflect organizational priorities. TPC will forward events signaling topology changes or updates to either an SNMP manager or the Tivoli® Enterprise Console (TEC), or both. These programs can be integrated with alerts from other sources to ensure that a single consistent view of application and systems availability can be maintained when storage is used in a SAN configuration. Out-of- line conditions can then be used to drive both change and problem management processes. Source side filtering at the Tivoli SAN Manager allows you to control what events get sent to your centralized console. Filtering out informational and duplicate events helps ensure that the administrators get the information they need and are not overwhelmed by extraneous information. The Tivoli Enterprise Console or SNMP Manager console provides a single consolidated view for systems administrators, whereas SAN administrators are primarily interested in the events that affect the SAN. Tivoli SAN Manager provides all of the tools required to manage the SAN topology and configuration. However, to assist in error determination and diagnosis, additional device-specific information is of valuable assistance. This information can either be obtained from the element or device logs or from the vendor-specific SNMP traps. SNMP device traps could either be collected at an existing SNMP manager console (NetView® Enterprise in a Tivoli environment) or the NetView provided with Tivoli SAN Manager could be used. In short, TPC for Fabric allows systems administrators to manage storage devices and provisions storage resources and capacity for both new and normal operations on a single console. For more informationFor more information about this tool, go to the IBM TotalStorage Productivity Center page. |
©Copyright IBM Corp. 2005, 2008. All Rights Reserved. |