| Tool Mentor: TPA - Predict Future Usage |
 |
|
| Related Elements |
|---|
ContextTool mentors explain how a tool can perform tasks, which are part of ITUP processes and activities. The tasks are listed as Related Elements in the Relationships section. You can see the details of how processes and activities are supported by this tool mentor, by clicking the links next to the icons: DetailsIBM® Tivoli® Performance Analyzer (ITPA) is a seamless extension to IBM Tivoli Monitoring (ITM). It extends ITM by adding targeted performance and capacity management capabilities. ITM itself provides extensive data collection capabilities enabling it to monitor IT performance and availability for system, application and user experience standpoints. Through the Tivoli Data Warehouse (TDW), ITM enables the integration of historical, near-term and real-time information in a single, customizable user interface. ITPA leverages the data collected by ITM and applies performance and capacity analytics to produce targeted reports. A key analytic provided by ITPA is predictive trending. ITPA forecasts future values of key metrics using on a flexible and transparent trending module which provides trend direction and strength indicators to enable the clear understanding of future usage. The Trending Analytic provides two types of forecast output.
The Forecast analytics generated by ITPA can be treated just like any other ITM metric. For example they can be used in reporting, combined into status objects and used to create events and situations. Using trending information in reports enables users to answer questions like:
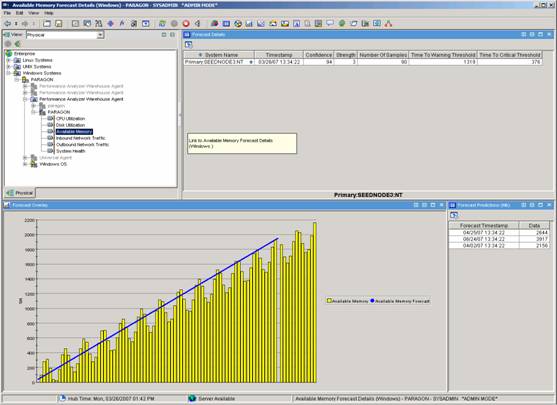 Figure 1: Forecast Reports in IBM Tivoli Performance Analyzer For More InformationFor more information about this tool, click on the link for this tool at the top of this page. |
©Copyright IBM Corp. 2005, 2008. All Rights Reserved. |