Tool Mentor: ITUAM - Evaluate Financial Management Performance
TM160 - How to Use the ITUAM to Evaluate Financial Management Performance
Tool: IBM Tivoli Usage and Accounting Manager
Relationships
Main Description

Context

Tool mentors explain how a tool can perform tasks, which are part of ITUP processes and activities. The tasks are listed as Related Elements in the Relationships section.

You can see the details of how processes and activities are supported by this tool mentor, by clicking the links next to the icons:

Details

With IBM® Tivoli® Usage and Accounting Manager you can perform financial analysis functions from your desktop simply and easily using only your web browser. The IT accounting and chargeback data that is consolidated by Tivoli Decision Support for z/OS and a wide variety of other data collectors is stored in a relational database and presented to the end-user through a series of web based reports and/or spreadsheets. This tool provides a framework of extensive reporting capabilities that allow you to analyze your budget and revenue data to make informed decisions on the effectiveness of your IT processes.

The reporting and analysis functions of IBM Tivoli Usage and Accounting Manager can help you make informed decisions as to the effectiveness of your IT environment and whether changes need to be made to meet your accounting goals. Reporting and analysis may be performed based on user defined time period (day(s), week(s), billing period(s), etc.). Some of the analysis reporting capabilities are:

  • Top Cost Report (by account) - This report displays the top (nn) accounts with the highest charges within the reporting date parameters specified. If a specific number of accounts are not specified, the top ten accounts are displayed. A hyperlink is provided to the invoice report for each account displayed on this report. While this is a linear report there are reports that provide the similar information in both graphical (Bar Graph, Pie Chart) and linear format.

    Screenshot of Top Cost Report

  • Top Accounts by Rate Code - Similar in concept to the "Top Cost Report" is the "Top Account by Rate Code". This report presents the top (nn) accounts by specific line item (Rate Code) rather than just account. This allows the system administrator or end-user to easily identify specific resource abuse by account.

    Screenshot of Top Accounts by Rate Code

  • Drilldown - If a specific line item on a report shows an abnormal change in utilization, it is possible to perform a drilldown to determine the person/area/account responsible for the change in resource consumption. The criteria used for drilldown are determined by the system administrator and normally vary by OS or application. From one to five drilldown criteria may be used to interrogate the system.

    Screenshot of Invoice

    Screenshot of Invoice Drilldown

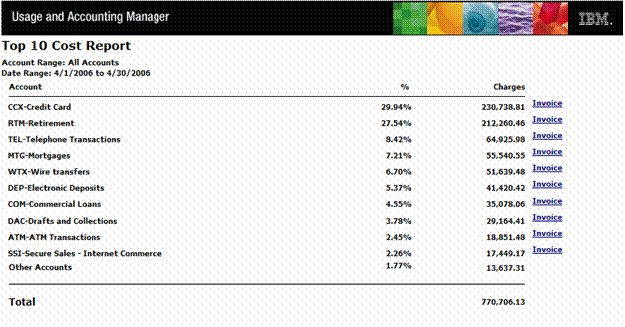
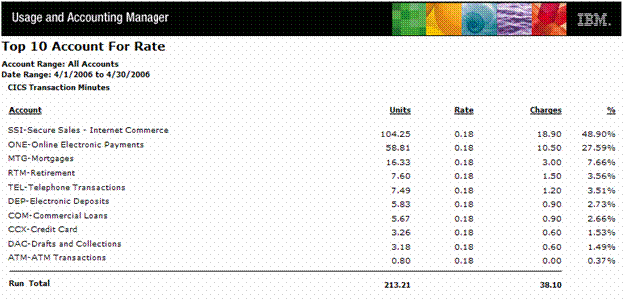
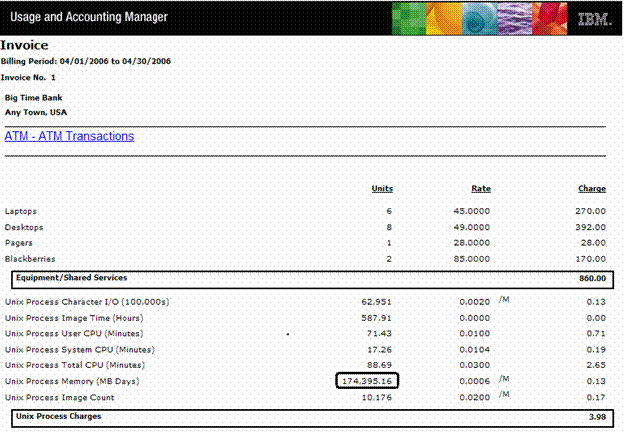
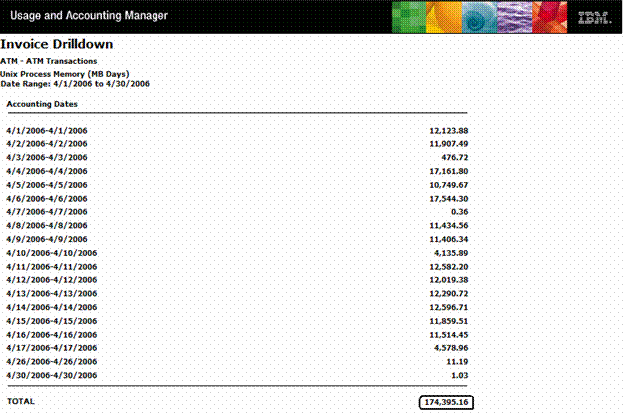
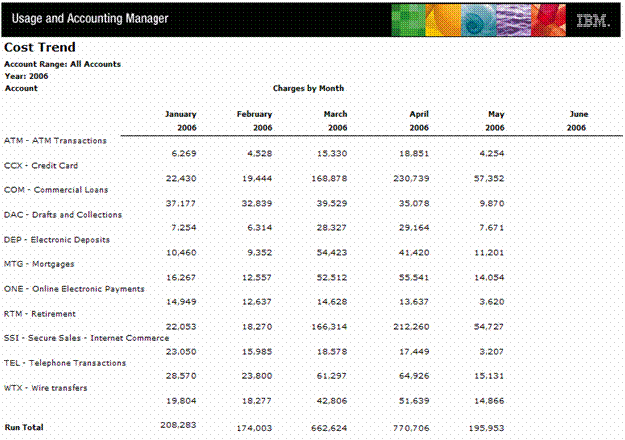
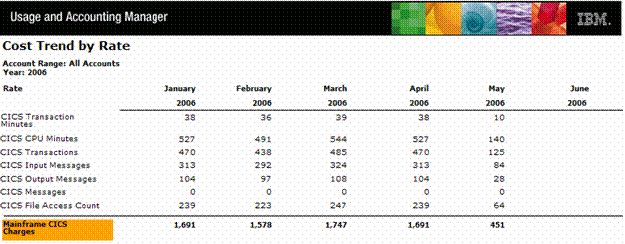
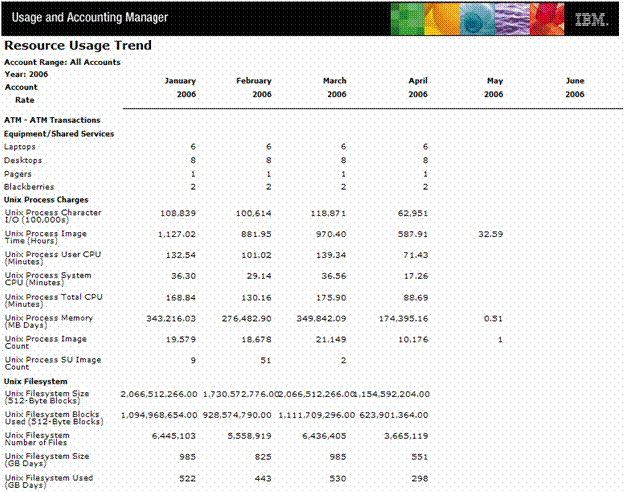
Several reports are also available with IBM Tivoli Usage and Accounting Manager that can aid in evaluating the effectiveness of the financial management process over a period of time.

  • Cost Trend Report - This report displays total charges by account for each month of the year. The monthly charges for each account are presented on a single line.

    Screenshot of Cost Trend Report

  • Cost Trend by Rate Report - This report displays charges by month and account for each invoice line item and line item subtotal.

    Screenshot of Cost Tread by Rate Report

  • Resource Usage Trend Report - This report is similar to the "cost Trend by Rate Report" but the statistics presented represent utilization rather than costs.

    Screenshot of Resource Usage Trend Report

Details on specific reporting and analysis functions can be found in the IBM Tivoli Usage and Accounting Manager Web Reporting User Guide, Appendix A - Standard Reports.

For More Information

For more information about this tool, click on the link for this tool at the top of this page.