Context
Tool mentors explain how a tool can perform tasks, which are part of ITUP processes and activities. The tasks are listed as Related Elements in the Relationships section.
You can see the details of how processes and activities are supported by this tool mentor, by clicking the links next to the icons:
Details
Because changes to applications are normally completed in very short periods of time and the implications not always
thought through, these changes can frequently degrade the performance characteristics of the applications. If
performance has noticeably declined, this may result in a complicated roll back process that often takes hours to
complete.
Another possibility is the misreading of test results. Very often tests are performed, but due to the lack of baseline
metrics against which to compare, hidden issues are overlooked because the tester assumes that the application has
always performed that way.
Running the application through the Production Eligibility Checkpoint Process and using baselines in the reporting is
recommended in order to avoid rollbacks or other disagreeable results in a production environment. This process ensures
the basic understanding of the 'weight' and 'behavior' of the application in production, and its impact on various
resource managers.
Following is an example of how a user would populate the ITCAM for WebSphere® performance database with data, and then
run the Production Eligibility Checkpoint (PEC) reports.
-
Prepare the a test environment that emulates the production environment
-
Configure IBM® Tivoli® Composite Application Manager (ITCAM) for WebSphere to collect data on the web application
servers at level one
-
Configure Rational Performance Tester (RPT) to execute the previously recorded transactions when the application is
initially rolled out. These transactions emulate a typical production load for a period of a day.
-
Configure RPT to execute the transactions at a consistent high throughput load for a period of a couple of hours,
and schedule this to begin after the previous test.
-
After the desired period of time has elapsed to collect the appropriate amount of MOD level one data, configure
ITCAM for WebSphere to collect data at MOD level three.
-
Configure RPT to execute the previously recorded transactions (at a non-stress load) for an additional specified
period of time.
-
Log into the ITCAM for WebSphere User Interface and access the PEC report to include in the RFC. This report
provides a high level status using a red or green status, along with average, minimum, and max values, and
threshold information for the following data:
-
Response Time
-
CPU Time
-
Throughput
-
System CPU Usage
-
JVM CPU Usage
-
JVM Heap Memory Usage
-
Nested Request Metrics
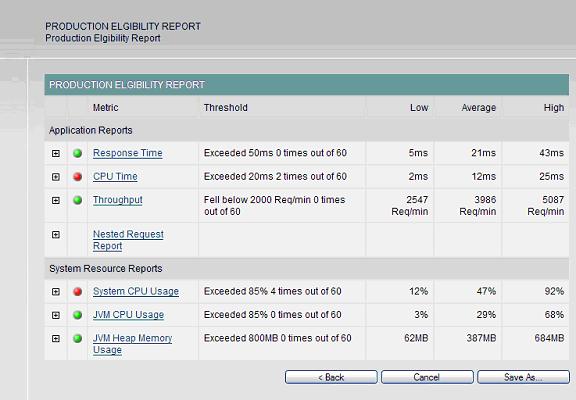
Figure 1: Production Eligibility report
-
Each summary report on the production eligibility report is a link which will provide drill-down to see the
detailed specific report compared against the baseline report that can also be included in the RFC.
-
Throughput rate per minute over time compared against the previously stored baseline report
-
Average System CPU usage over time compared against the previously stored baseline report
-
Average JVM CPU usage over time compared against the previously stored baseline report
-
Response Time compared against the previously stored baseline report
-
CPU Time per request compared against the previously stored baseline report
-
JVM Heap Memory Usage compared against the previously stored baseline report
-
Nested request metrics compared against the previously stored baseline report which contains the following
information:
-
Average # of method invocations per request
-
Validate with this report that the execution path of the application has not changed
significantly compared to the baseline.
-
Average # of JDBC calls per request
-
Validate with this report that the execution path of the application contains a similar
number of JDBC invocations as the baseline.
-
Average # of EJB calls per request
-
Validate with this report that the execution path of the application contains more EJB
invocations than the baseline
-
Average # of JMS/MQI calls per request
-
Validate with this report that the execution path of the application contains a similar
number of JMS and MQI invocations as invocations as the baseline.
-
Average # of JSP invocations
-
Validate with this report that the execution path of the application contains a similar
number of JSP invocations as the baseline.
For More Information
For more information about this tool, click on the link for this tool at the top of this page.
|
